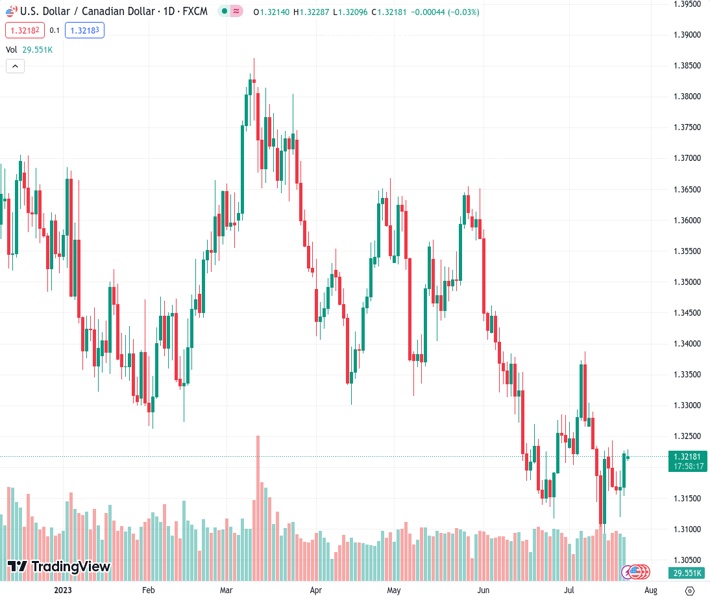
Despite lacking momentum, the USDCAD pair experienced a reversal from its highest level in a week, breaking its two-day winning streak.
…
This is a premium post.
[s2If !current_user_can(access_s2member_level4)]Please register for FREE REGISTER to read full post below containing analysis. In case of any error or you think you are not able to read the full post below, please email us at support#nehcap.com [lwa][/s2If] [s2If current_user_can(access_s2member_level1)]
- USD/CAD reverses from the highest level in a week, snaps two-day winning streak despite lacking momentum.
The pair currently trades last at 1.32202.
The previous day high was 1.3226 while the previous day low was 1.3153. The daily 38.2% Fib levels comes at 1.3198, expected to provide support. Similarly, the daily 61.8% fib level is at 1.3181, expected to provide support.
USD/CAD stays defensive around 1.3220 as it struggles to defend the weekly gains ahead of the top-tier data/events during early Monday. In doing so, the Loonie pair also hesitates in cheering a pullback in the US Dollar amid sluggish Oil prices.
That said, the US Dollar Index (DXY) renews its intraday low near 101.00 as it retreats from the highest level in eight days while portraying the market’s cautious mood. With this, the greenback’s gauge versus six major currencies prints the first daily loss in five, after reversing from the lowest levels since April 2022 in the last week.
On the other hand, WTI crude oil remains indecisive near $76.75, making rounds to the highest levels in three months as energy traders struggle to digest mixed comments from International Energy Agency (IEA) Executive Director Fatih Barol and United Arab Emirates (UAE) Energy Minister Suhail al-Mazrouei at the Group of 20 (G20) energy ministers’ meeting held in India.
Also read: WTI consolidates gains above $76.60 ahead of FOMC
It should be noted that the latest headlines suggesting more China-Taiwan tussles, which in turn result in Sino-US tension and weigh on the market sentiment, prod the USD/CAD bears amid a sluggish session.
In the last week, the US housing numbers and regional manufacturing indices were mostly downbeat but an improvement in the Retail Sales Control Group for June allowed the DXY to rebound from a 15-month low, as well as post the first weekly gain in three. Previously, the upbeat prints of the University of Michigan’s (UoM) Consumer Sentiment Index and consumer inflation expectations for July helped the greenback to challenge the bearish bias. It’s worth noting, however, that the US Consumer Price Index (CPI) and Producer Price Index (PPI) for June joined the first below-expectations Nonfarm Payrolls (NFP) in 15 months to tease the Federal Reserve’s (Fed) policy pivot past July and drowned the US Dollar.
On the other hand, downside Canada inflation data also allowed the USD/CAD pair to print the weekly gain.
Moving on, the preliminary readings of the US S&P Global PMIs for July will direct intraday moves of the USD/CAD pair ahead of the key Federal Reserve (Fed) monetary policy meeting announcements. Also important to watch are the first readings of the US second-quarter (Q2) 2023 Gross Domestic Product (GDP) and the monthly Canadian GDP for May.
A falling wedge chart pattern on the daily formation keeps the USD/CAD buyers hopeful unless the quote drops below the 1.3030 mark. That said, the bulls should wait for a clear upside break of 1.3255 for conviction.
Technical Levels: Supports and Resistances
USDCAD currently trading at 1.3217 at the time of writing. Pair opened at 1.3223 and is trading with a change of -0.05% % .
| Overview | Overview.1 | |
|---|---|---|
| 0 | Today last price | 1.3217 |
| 1 | Today Daily Change | -0.0006 |
| 2 | Today Daily Change % | -0.05% |
| 3 | Today daily open | 1.3223 |
The pair remains strongly bearish on the daily time frame. It trades below the 20 SMA @ 1.3223, 50 SMA 1.3333, 100 SMA @ 1.3451 and 200 SMA @ 1.3476.
| Trends | Trends.1 | |
|---|---|---|
| 0 | Daily SMA20 | 1.3223 |
| 1 | Daily SMA50 | 1.3333 |
| 2 | Daily SMA100 | 1.3451 |
| 3 | Daily SMA200 | 1.3476 |
The previous day high was 1.3226 while the previous day low was 1.3153. The daily 38.2% Fib levels comes at 1.3198, expected to provide support. Similarly, the daily 61.8% fib level is at 1.3181, expected to provide support.
Note the levels of interest below:
- Pivot support is noted at 1.3175, 1.3128, 1.3102
- Pivot resistance is noted at 1.3249, 1.3274, 1.3322
| Levels | Levels.1 |
|---|---|
| Previous Daily High | 1.3226 |
| Previous Daily Low | 1.3153 |
| Previous Weekly High | 1.3244 |
| Previous Weekly Low | 1.3120 |
| Previous Monthly High | 1.3585 |
| Previous Monthly Low | 1.3117 |
| Daily Fibonacci 38.2% | 1.3198 |
| Daily Fibonacci 61.8% | 1.3181 |
| Daily Pivot Point S1 | 1.3175 |
| Daily Pivot Point S2 | 1.3128 |
| Daily Pivot Point S3 | 1.3102 |
| Daily Pivot Point R1 | 1.3249 |
| Daily Pivot Point R2 | 1.3274 |
| Daily Pivot Point R3 | 1.3322 |
[/s2If]
Download Nehcap EAWe have two EAs that are operational on our LIVE accounts.
- EA-FIX: Check out the details here. Download EA-FIX . EA-FIX is a non-grid HFT scalper.
- EA-GROWTH: High quality low dd EA using trend grids. Download EA_GROWTHJoin Our Telegram Group
")


