With a positive sentiment boosting the Mexican Peso (MXN) against the US Dollar (USD), concerns about the Federal Reserve tightening its policies have emerged following the release of last week’s US unemployment data.
…
This is a premium post.
[s2If !current_user_can(access_s2member_level4)]Please register for FREE REGISTER to read full post below containing analysis. In case of any error or you think you are not able to read the full post below, please email us at support#nehcap.com [lwa][/s2If] [s2If current_user_can(access_s2member_level1)]
- Positive sentiment supports the Mexican Peso (MXN), but Fed tightening concerns arise due to last week’s US unemployment data.
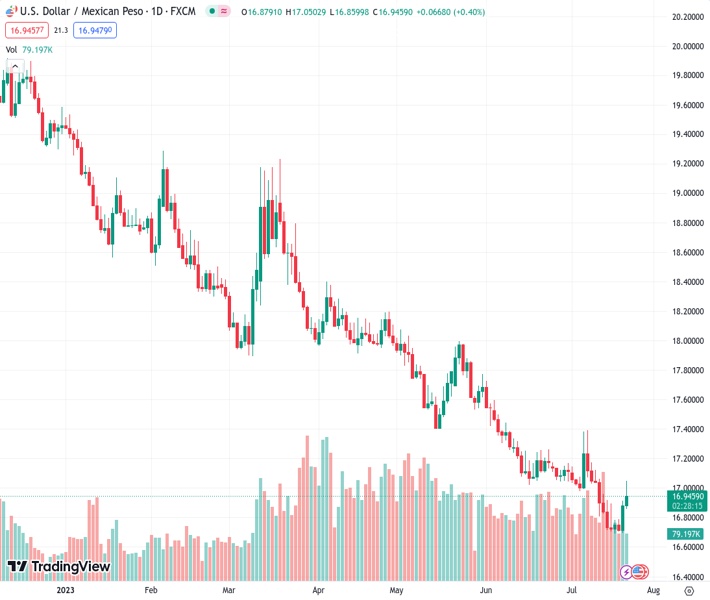
The pair currently trades last at 16.9483.
The previous day high was 16.9154 while the previous day low was 16.7032. The daily 38.2% Fib levels comes at 16.8344, expected to provide support. Similarly, the daily 61.8% fib level is at 16.7843, expected to provide support.
USD/MXN holds to its earlier gains after reaching the 17.00 figure on Friday but trimmed some as the USD/MXN pair edged towards the 20-day Exponential Moving Average (EMA) at 16.9666. At the time of writing, the USD/MXN is trading at 16.9494, climbing 0.47%, ahead of the weekend.
Sentiment remains upbeat, which usually favors the Mexican Peso (MXN). Nevertheless, last week’s US unemployment claims for the week ending July 15 spurred woes the Federal Reserve (Fed) would continue to tighten monetary conditions past the July meeting. Other data revealed during the day was mixed, with US retail sales missing estimates, but continued to show consumers resilience, while housing market data witnessed a dip after registering positive figures in May.
Meanwhile, expectations the Fed would raise rates past the July meeting surged to 28%, from last month’s 15.9% odds, as revealed by the CME FedWatch Tool.
Consequently, the greenback rose, registering more than 1% weekly gains. As of writing, the US Dollar Index (DXY), a measure that tracks the performance of the US Dollar against six peers, sits at 101.052, which advances 0.23%, on Friday.
That helped to offset some of the USD/MXN 4.27% losses during the last couple of weeks, with the pair briefly testing the 17.00 psychological barrier.
Retail sales disappointed USD/MXN traders on the Mexican front, which punished the peso as the pair climbed 1% on Thursday. On its latest two meetings, the Bank of Mexico (Banxico) kept rates unchanged at 11.25% and is expected to cut rates towards Q4 2023.
The following week’s highlight on the Mexican docket would be the inflation data report, with most traders expecting the Consumer Price Index (CP) at 4.77% in the first 15 days of the month, according to a Reuters poll. Core CPI is expected to slide to 6.73%. Although both figures remain above Banxico’s 3% plus or minus one percentage point target, the disinflationary process continues in the Mexican economy.
From a technical standpoint, the USD/MXN probed the 17.00 figure after reaching 7-year lows at 16.6899 but couldn’t break resistance, despite printing a high of 17.0502. Of note, the Relative Strength Index (RSI) indicator is gathering pace toward the 50-midline, suggesting that buyers are increasing their positions, while the three-day Rate of Change (RoC) printed its biggest daily gain since May 23, a major turning point. That could suggest the USD/MXN could be bottoming and preparing for an upward correction. Key resistance levels lie at the 20-day EMA at 16.9667, the 17.00 figure, and the 50-day EMa at 17.2416 in the near term. Contrarily, the first support level would be the YTD low of 16.6899 before testing 16.50.
Technical Levels: Supports and Resistances
USDMXN currently trading at 16.9406 at the time of writing. Pair opened at 16.89 and is trading with a change of 0.3 % .
| Overview | Overview.1 | |
|---|---|---|
| 0 | Today last price | 16.9406 |
| 1 | Today Daily Change | 0.0506 |
| 2 | Today Daily Change % | 0.3000 |
| 3 | Today daily open | 16.8900 |
The pair remains strongly bearish on the daily time frame. It trades below the 20 SMA @ 16.9958, 50 SMA 17.2808, 100 SMA @ 17.7278 and 200 SMA @ 18.4819.
| Trends | Trends.1 | |
|---|---|---|
| 0 | Daily SMA20 | 16.9958 |
| 1 | Daily SMA50 | 17.2808 |
| 2 | Daily SMA100 | 17.7278 |
| 3 | Daily SMA200 | 18.4819 |
The previous day high was 16.9154 while the previous day low was 16.7032. The daily 38.2% Fib levels comes at 16.8344, expected to provide support. Similarly, the daily 61.8% fib level is at 16.7843, expected to provide support.
Note the levels of interest below:
- Pivot support is noted at 16.7571, 16.6241, 16.5449
- Pivot resistance is noted at 16.9692, 17.0484, 17.1814
| Levels | Levels.1 |
|---|---|
| Previous Daily High | 16.9154 |
| Previous Daily Low | 16.7032 |
| Previous Weekly High | 17.1746 |
| Previous Weekly Low | 16.7167 |
| Previous Monthly High | 17.7286 |
| Previous Monthly Low | 17.0243 |
| Daily Fibonacci 38.2% | 16.8344 |
| Daily Fibonacci 61.8% | 16.7843 |
| Daily Pivot Point S1 | 16.7571 |
| Daily Pivot Point S2 | 16.6241 |
| Daily Pivot Point S3 | 16.5449 |
| Daily Pivot Point R1 | 16.9692 |
| Daily Pivot Point R2 | 17.0484 |
| Daily Pivot Point R3 | 17.1814 |
[/s2If]
Download Nehcap EAWe have two EAs that are operational on our LIVE accounts.
- EA-FIX: Check out the details here. Download EA-FIX . EA-FIX is a non-grid HFT scalper.
- EA-GROWTH: High quality low dd EA using trend grids. Download EA_GROWTHJoin Our Telegram Group
")


