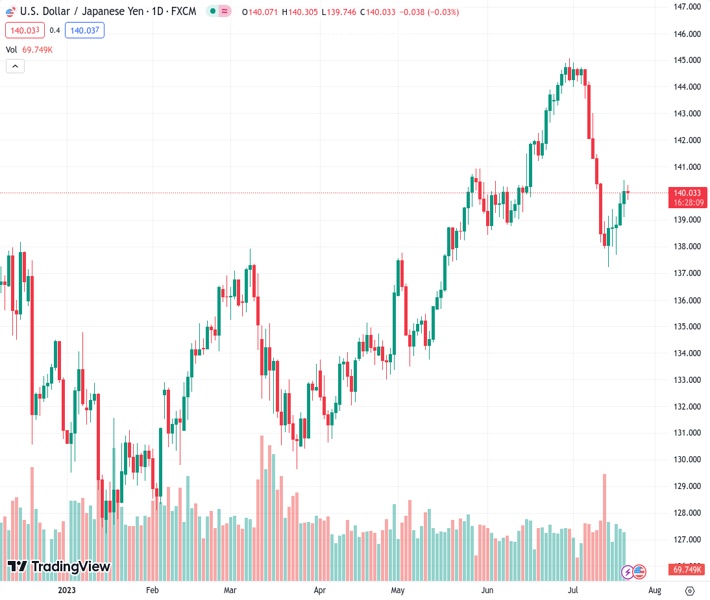
The USDJPY is slightly increasing near the highest point of the week following a four-day upward trend.
…
This is a premium post.
[s2If !current_user_can(access_s2member_level4)]Please register for FREE REGISTER to read full post below containing analysis. In case of any error or you think you are not able to read the full post below, please email us at support#nehcap.com [lwa][/s2If] [s2If current_user_can(access_s2member_level1)]
- USD/JPY edges higher around the weekly top after four-day uptrend.
The pair currently trades last at 140.045.
The previous day high was 140.5 while the previous day low was 139.11. The daily 38.2% Fib levels comes at 139.97, expected to provide support. Similarly, the daily 61.8% fib level is at 139.64, expected to provide support.
USD/JPY clings to mild gains around 140.15-20 as it seesaws near the weekly top while rising for the fourth consecutive day ahead of Friday’s European session. In doing so, the Yen pair braces for the first weekly gain in three while ignoring upbeat Japan inflation and softer yields amid dovish concerns about the Bank of Japan (BoJ).
As per the latest Reuters poll, conducted between July 10 and 19, more than 75% respondents favor the BoJ’s inaction during the next week’s monetary policy meeting. In doing so, the Japanese central bank won’t even alter the Yield Curve Control (YCC) policy, signals the survey report.
Earlier in the day, Japan inflation per the National Consumer Price Index (CPI), for June rose to 3.3% YoY from 3.2% versus 3.5% expected. Further details unveil that the National CPI ex Fresh Food matches 3.3% YoY forecasts, improving from 3.2% prior, whereas the National CPI ex Food, Energy eases to 4.2% expected figures compared to 4.3% previous readings.
On Thursday, Japanese government announced a downward revision of the Asian major’s Financial Year (FY) 2023-24 growth forecasts to 1.3% versus the previously expected 1.5% figures. Also, Japan Prime Minister (PM) Fumio Kishida defends the dovish concerns about the Bank of Japan (BoJ) by showing readiness to create a society where wage hikes become a norm.
That said, the US Dollar Index (DXY) jumped the most in a month to refresh the weekly top the previous day before recently retreating to 100.80. In doing so, the greenback’s gauge versus the six major currencies portrays the market’s positioning for the next week’s Federal Open Market Committee (FOMC) monetary policy meeting announcements after cheering mostly upbeat US job clues. That said, US Initial Jobless Claims dropped to 228K for the week ended on July 14, the lowest since May, versus 237K prior and 242K market forecasts.
On a different page, the Wall Street benchmark closed in the red amid downbeat performance of energy and technology shares, which in turn exerts downside pressure on Japan’s Nikkei 225 but the S&P500 Futures remain indecisive after reversing from the yearly high. Further, the US Treasury bond yields refreshed their weekly highs the previous day and propelled the US Dollar before the latest retreat.
Looking ahead, a light calendar may restrict immediate USD/JPY moves before the next week’s monetary policy meetings of the Fed and the BoJ. However, the risk catalysts may entertain the traders.
Although the 200-DMA puts a floor under the USD/JPY prices near 136.90, the Yen pair’s immediate upside appears guarded by the 50-DMA hurdle of 140.60.
Technical Levels: Supports and Resistances
USDJPY currently trading at 140.14 at the time of writing. Pair opened at 140.08 and is trading with a change of 0.04% % .
| Overview | Overview.1 | |
|---|---|---|
| 0 | Today last price | 140.14 |
| 1 | Today Daily Change | 0.06 |
| 2 | Today Daily Change % | 0.04% |
| 3 | Today daily open | 140.08 |
The pair is trading below its 20 Daily moving average @ 141.96, below its 50 Daily moving average @ 140.51 , above its 100 Daily moving average @ 137.14 and above its 200 Daily moving average @ 136.95
| Trends | Trends.1 | |
|---|---|---|
| 0 | Daily SMA20 | 141.96 |
| 1 | Daily SMA50 | 140.51 |
| 2 | Daily SMA100 | 137.14 |
| 3 | Daily SMA200 | 136.95 |
The previous day high was 140.5 while the previous day low was 139.11. The daily 38.2% Fib levels comes at 139.97, expected to provide support. Similarly, the daily 61.8% fib level is at 139.64, expected to provide support.
Note the levels of interest below:
- Pivot support is noted at 139.29, 138.51, 137.91
- Pivot resistance is noted at 140.68, 141.28, 142.07
| Levels | Levels.1 |
|---|---|
| Previous Daily High | 140.50 |
| Previous Daily Low | 139.11 |
| Previous Weekly High | 143.00 |
| Previous Weekly Low | 137.24 |
| Previous Monthly High | 145.07 |
| Previous Monthly Low | 138.43 |
| Daily Fibonacci 38.2% | 139.97 |
| Daily Fibonacci 61.8% | 139.64 |
| Daily Pivot Point S1 | 139.29 |
| Daily Pivot Point S2 | 138.51 |
| Daily Pivot Point S3 | 137.91 |
| Daily Pivot Point R1 | 140.68 |
| Daily Pivot Point R2 | 141.28 |
| Daily Pivot Point R3 | 142.07 |
[/s2If]
Download Nehcap EAWe have two EAs that are operational on our LIVE accounts.
- EA-FIX: Check out the details here. Download EA-FIX . EA-FIX is a non-grid HFT scalper.
- EA-GROWTH: High quality low dd EA using trend grids. Download EA_GROWTHJoin Our Telegram Group
")


