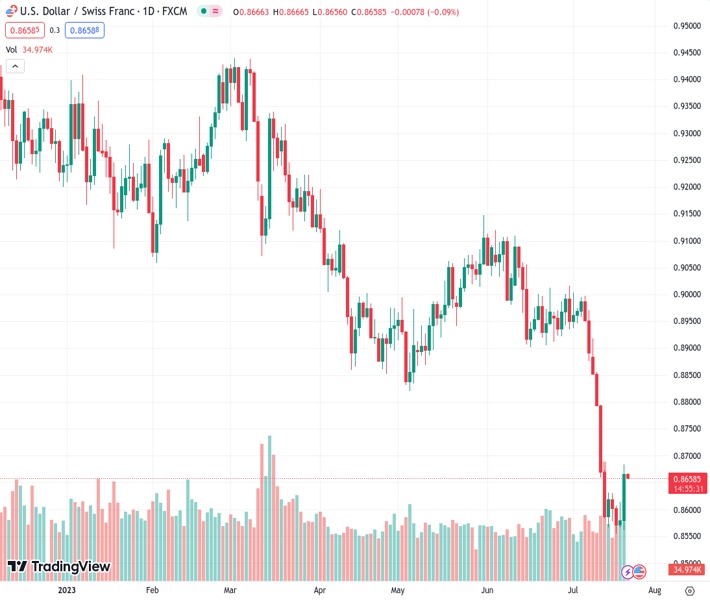
The USDCHF pair, currently at 0.86599, has seen a slight increase during the first week of positivity in four weeks. However, it has recently experienced a decline in its two-day upward movement. Nehcap believes that a retracement is anticipated.
…
This is a premium post.
[s2If !current_user_can(access_s2member_level4)]Please register for FREE REGISTER to read full post below containing analysis. In case of any error or you think you are not able to read the full post below, please email us at support#nehcap.com [lwa][/s2If] [s2If current_user_can(access_s2member_level1)]
- USD/CHF edges higher during the first positive week, so far, in four despite snapping two-day uptrend.
The pair currently trades last at 0.86599.
The previous day high was 0.8684 while the previous day low was 0.8561. The daily 38.2% Fib levels comes at 0.8637, expected to provide support. Similarly, the daily 61.8% fib level is at 0.8608, expected to provide support.
USD/CHF treads water as it seesaws within a small trading range of around 15 pips above 0.8655 heading into Friday’s European session.
In doing so, the Swiss Franc (CHF) pair remains sidelined between the 200-Hour Moving Average (HMA) and a two-week-long downward-sloping resistance line. With this, the major currency pair braces for the first weekly gain in four, despite snapping a two-day winning streak with mild losses of late.
It’s worth noting that the overbought RSI and bearish MACD signals suggest the market favors the USD/CHF sellers. However, a clear break of the 200-HMA level of 0.8647 becomes necessary to convince the bears.
Even so, a horizontal area comprising multiple levels marked since July 13, close to 0.8630-25, can challenge the USD/CHF sellers before directing them to the multi-year low marked earlier in the week around 0.8555. During the likely fall, the 0.8600 round figure may act as an intermediate halt.
Meanwhile, an upside clearance of the falling resistance line stretched from July 06, near 0.8670 at the latest, will need validation from the weekly high of around 0.8685, as well as the 0.8700 round figure to convince USD/CHF buyers.
In a case where the USD/CHF stays firmer past 0.8700, the July 12 swing high of near 0.8795 and the 0.8800 will be on the bull’s radar.
Trend: Pullback expected
Technical Levels: Supports and Resistances
USDCHF currently trading at 0.8663 at the time of writing. Pair opened at 0.8667 and is trading with a change of -0.05% % .
| Overview | Overview.1 | |
|---|---|---|
| 0 | Today last price | 0.8663 |
| 1 | Today Daily Change | -0.0004 |
| 2 | Today Daily Change % | -0.05% |
| 3 | Today daily open | 0.8667 |
The pair remains strongly bearish on the daily time frame. It trades below the 20 SMA @ 0.8825, 50 SMA 0.8941, 100 SMA @ 0.9009 and 200 SMA @ 0.9225.
| Trends | Trends.1 | |
|---|---|---|
| 0 | Daily SMA20 | 0.8825 |
| 1 | Daily SMA50 | 0.8941 |
| 2 | Daily SMA100 | 0.9009 |
| 3 | Daily SMA200 | 0.9225 |
The previous day high was 0.8684 while the previous day low was 0.8561. The daily 38.2% Fib levels comes at 0.8637, expected to provide support. Similarly, the daily 61.8% fib level is at 0.8608, expected to provide support.
Note the levels of interest below:
- Pivot support is noted at 0.8591, 0.8514, 0.8467
- Pivot resistance is noted at 0.8714, 0.8761, 0.8837
| Levels | Levels.1 |
|---|---|
| Previous Daily High | 0.8684 |
| Previous Daily Low | 0.8561 |
| Previous Weekly High | 0.8918 |
| Previous Weekly Low | 0.8566 |
| Previous Monthly High | 0.9120 |
| Previous Monthly Low | 0.8902 |
| Daily Fibonacci 38.2% | 0.8637 |
| Daily Fibonacci 61.8% | 0.8608 |
| Daily Pivot Point S1 | 0.8591 |
| Daily Pivot Point S2 | 0.8514 |
| Daily Pivot Point S3 | 0.8467 |
| Daily Pivot Point R1 | 0.8714 |
| Daily Pivot Point R2 | 0.8761 |
| Daily Pivot Point R3 | 0.8837 |
[/s2If]
Download Nehcap EAWe have two EAs that are operational on our LIVE accounts.
- EA-FIX: Check out the details here. Download EA-FIX . EA-FIX is a non-grid HFT scalper.
- EA-GROWTH: High quality low dd EA using trend grids. Download EA_GROWTHJoin Our Telegram Group
")


