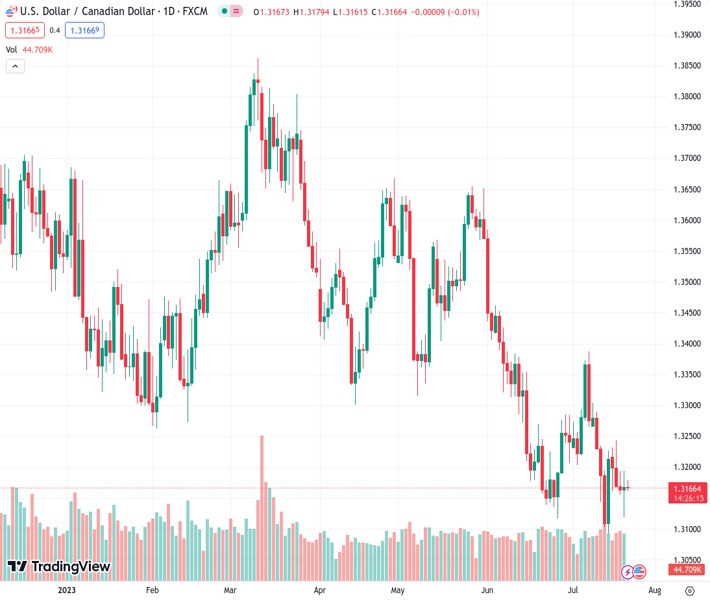
The USDCAD pair is currently uncertain at a rate of 1.31679 and is finding it challenging to continue the upward movement achieved on the previous day after hitting a low point for the week. According to the outlook provided by @nehcap, it is anticipated that there will be a further improvement in the currency pair.
…
This is a premium post.
[s2If !current_user_can(access_s2member_level4)]Please register for FREE REGISTER to read full post below containing analysis. In case of any error or you think you are not able to read the full post below, please email us at support#nehcap.com [lwa][/s2If] [s2If current_user_can(access_s2member_level1)]
- USD/CAD remains indecisive, struggles to extend previous day’s rebound from weekly low.
The pair currently trades last at 1.31679.
The previous day high was 1.3194 while the previous day low was 1.312. The daily 38.2% Fib levels comes at 1.3166, expected to provide support. Similarly, the daily 61.8% fib level is at 1.3148, expected to provide support.
USD/CAD aptly portrays the pre-data anxiety around 1.3170 heading into Friday’s European session. In doing so, the Loonie pair showcases the trader’s cautious mood ahead of the Canadian Retail Sales data for June amid a lackluster market comprising no major data/events.
Also read: USD/CAD stuck in a narrow range above mid-1.3100s, rising Oil prices act as a headwind
Apart from Canada Retail Sales for June, expected 0.5% MoM versus 1.1% prior, the inverse head-and-shoulders (H&S) bullish chart formation, with a neckline surrounding 1.3200, also highlights the USD/CAD pair for trading.
That said, the upward-sloping RSI (14) line suggests the quote’s gradual recovery despite declining for the second consecutive week so far.
It should be noted that a fortnight-old descending trend line joins the 200-Hour Moving Average (HMA) to suggest the 1.3185 level as the short-term key hurdle.
Hence, the USD/CAD pair is likely to edge higher but the upside momentum needs acceptance from the 1.3200 and the Canadian Retail Sales data. Following that, the weekly peak of 1.3245 and the July 10 high surrounding 1.3300 should lure the bulls.
On the contrary, the previous day’s low around 1.3120 and the 1.3100 round figure could challenge the USD/CAD bears before giving them control.
In that case, the multi-month low marked the last Friday around 1.3090 may act as an additional downside filter prior to pleasing the sellers with the 1.3000 round figure.
Trend: Further recovery expected
Technical Levels: Supports and Resistances
USDCAD currently trading at 1.3171 at the time of writing. Pair opened at 1.3172 and is trading with a change of -0.01% % .
| Overview | Overview.1 | |
|---|---|---|
| 0 | Today last price | 1.3171 |
| 1 | Today Daily Change | -0.0001 |
| 2 | Today Daily Change % | -0.01% |
| 3 | Today daily open | 1.3172 |
The pair remains strongly bearish on the daily time frame. It trades below the 20 SMA @ 1.3221, 50 SMA 1.334, 100 SMA @ 1.3455 and 200 SMA @ 1.348.
| Trends | Trends.1 | |
|---|---|---|
| 0 | Daily SMA20 | 1.3221 |
| 1 | Daily SMA50 | 1.3340 |
| 2 | Daily SMA100 | 1.3455 |
| 3 | Daily SMA200 | 1.3480 |
The previous day high was 1.3194 while the previous day low was 1.312. The daily 38.2% Fib levels comes at 1.3166, expected to provide support. Similarly, the daily 61.8% fib level is at 1.3148, expected to provide support.
Note the levels of interest below:
- Pivot support is noted at 1.313, 1.3087, 1.3055
- Pivot resistance is noted at 1.3205, 1.3237, 1.328
| Levels | Levels.1 |
|---|---|
| Previous Daily High | 1.3194 |
| Previous Daily Low | 1.3120 |
| Previous Weekly High | 1.3304 |
| Previous Weekly Low | 1.3093 |
| Previous Monthly High | 1.3585 |
| Previous Monthly Low | 1.3117 |
| Daily Fibonacci 38.2% | 1.3166 |
| Daily Fibonacci 61.8% | 1.3148 |
| Daily Pivot Point S1 | 1.3130 |
| Daily Pivot Point S2 | 1.3087 |
| Daily Pivot Point S3 | 1.3055 |
| Daily Pivot Point R1 | 1.3205 |
| Daily Pivot Point R2 | 1.3237 |
| Daily Pivot Point R3 | 1.3280 |
[/s2If]
Download Nehcap EAWe have two EAs that are operational on our LIVE accounts.
- EA-FIX: Check out the details here. Download EA-FIX . EA-FIX is a non-grid HFT scalper.
- EA-GROWTH: High quality low dd EA using trend grids. Download EA_GROWTHJoin Our Telegram Group
")


