The USDCAD is showing little clarity in its intraday movement and is instead moving within a tight range on Friday.
…
This is a premium post.
[s2If !current_user_can(access_s2member_level4)]Please register for FREE REGISTER to read full post below containing analysis. In case of any error or you think you are not able to read the full post below, please email us at support#nehcap.com [lwa][/s2If] [s2If current_user_can(access_s2member_level1)]
- USD/CAD lacks any firm intraday direction and oscillates in a narrow trading band on Friday.
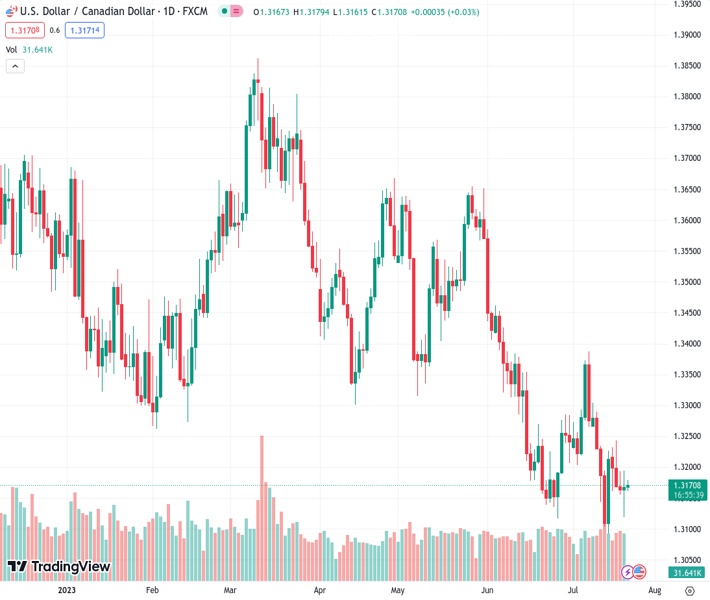
The pair currently trades last at 1.31714.
The previous day high was 1.3194 while the previous day low was 1.312. The daily 38.2% Fib levels comes at 1.3166, expected to provide support. Similarly, the daily 61.8% fib level is at 1.3148, expected to provide support.
The USD/CAD pair struggles to capitalize on the previous day’s late rebound from the 1.3120-1.3115 region, or the weekly low and oscillates in a narrow band through the Asian session on Friday. Spot prices currently trade around the 1.3165-1.3170 area, nearly unchanged for the day.
Crude Oil prices gain some positive traction for the second straight day, which underpins the commodity-linked Loonie and turns out to be a key factor acting as a headwind for the USD/CAD pair. Hopes that new stimulus measures from China will boost fuel demand in the world’s largest oil importer, along with the prospect of tighter global supplies, continue to act as a tailwind for the black liquid.
Apart from this, subdued US Dollar (USD) price action further contributes to capping the upside for the USD/CAD pair. In fact, the USD Index (DXY), which tracks the Greenback against a basket of currencies, consolidates the overnight strong gains to over a one-week high and for now, seems to have stalled the recent goodish recovery move from its lowest level since April 2022 touched earlier this week.
The downside for the USD, however, seems limited in the wake of the upbeat US macro data released on Thursday, which continues to flash strength in the US labour market and supports prospects for further tightening by the Federal Reserve (Fed). Furthermore, investors remain sceptic about whether the Fed will commit to a more dovish policy stance or stick to its forecast for a 50 bps rate hike this year.
This, in turn, might hold back traders from placing aggressive directional bets ahead of the crucial FOMC monetary policy decision, scheduled to be announced at the end of a two-day meeting on Wednesday. In the meantime, traders on Friday will take cues from the release of the monthly Canadian Retail Sales data, which might provide some impetus to the USD/CAD pair later during the early North American session.
Nevertheless, spot prices seem poised to end in the red for the second straight week and remain well within the striking distance of the lowest level since September 2022, just below the 1.3100 round-figure mark touched last week.
Technical Levels: Supports and Resistances
USDCAD currently trading at 1.3169 at the time of writing. Pair opened at 1.3172 and is trading with a change of -0.02 % .
| Overview | Overview.1 | |
|---|---|---|
| 0 | Today last price | 1.3169 |
| 1 | Today Daily Change | -0.0003 |
| 2 | Today Daily Change % | -0.0200 |
| 3 | Today daily open | 1.3172 |
The pair remains strongly bearish on the daily time frame. It trades below the 20 SMA @ 1.3221, 50 SMA 1.334, 100 SMA @ 1.3455 and 200 SMA @ 1.348.
| Trends | Trends.1 | |
|---|---|---|
| 0 | Daily SMA20 | 1.3221 |
| 1 | Daily SMA50 | 1.3340 |
| 2 | Daily SMA100 | 1.3455 |
| 3 | Daily SMA200 | 1.3480 |
The previous day high was 1.3194 while the previous day low was 1.312. The daily 38.2% Fib levels comes at 1.3166, expected to provide support. Similarly, the daily 61.8% fib level is at 1.3148, expected to provide support.
Note the levels of interest below:
- Pivot support is noted at 1.313, 1.3087, 1.3055
- Pivot resistance is noted at 1.3205, 1.3237, 1.328
| Levels | Levels.1 |
|---|---|
| Previous Daily High | 1.3194 |
| Previous Daily Low | 1.3120 |
| Previous Weekly High | 1.3304 |
| Previous Weekly Low | 1.3093 |
| Previous Monthly High | 1.3585 |
| Previous Monthly Low | 1.3117 |
| Daily Fibonacci 38.2% | 1.3166 |
| Daily Fibonacci 61.8% | 1.3148 |
| Daily Pivot Point S1 | 1.3130 |
| Daily Pivot Point S2 | 1.3087 |
| Daily Pivot Point S3 | 1.3055 |
| Daily Pivot Point R1 | 1.3205 |
| Daily Pivot Point R2 | 1.3237 |
| Daily Pivot Point R3 | 1.3280 |
[/s2If]
Download Nehcap EAWe have two EAs that are operational on our LIVE accounts.
- EA-FIX: Check out the details here. Download EA-FIX . EA-FIX is a non-grid HFT scalper.
- EA-GROWTH: High quality low dd EA using trend grids. Download EA_GROWTHJoin Our Telegram Group
")


