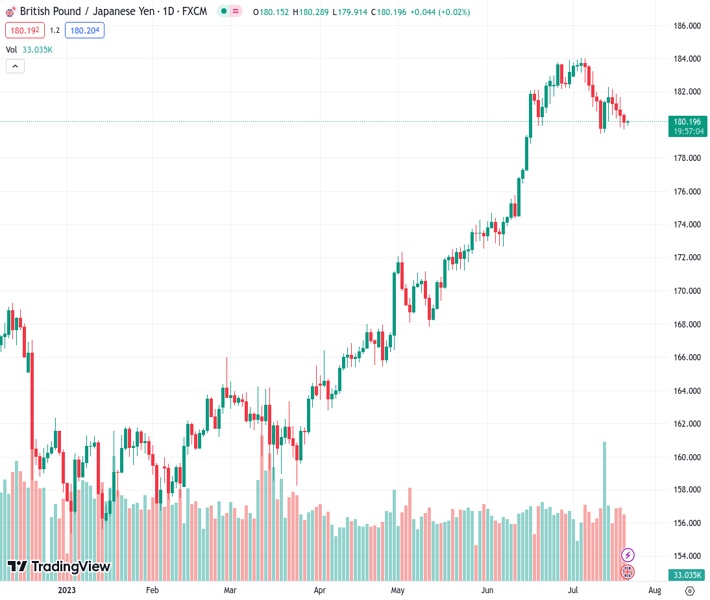
The GBPJPY pair, which was at 180.190, has rebounded from its lowest point of the day after experiencing a downward trend for the past five days. According to the viewpoint of @nehcap, it is predicted that there will be a minimal decrease in the currency pair.
…
This is a premium post.
[s2If !current_user_can(access_s2member_level4)]Please register for FREE REGISTER to read full post below containing analysis. In case of any error or you think you are not able to read the full post below, please email us at support#nehcap.com [lwa][/s2If] [s2If current_user_can(access_s2member_level1)]
- GBP/JPY bounces off intraday low during five-day downtrend.
The pair currently trades last at 180.190.
The previous day high was 180.72 while the previous day low was 179.74. The daily 38.2% Fib levels comes at 180.11, expected to provide support. Similarly, the daily 61.8% fib level is at 180.34, expected to provide resistance.
GBP/JPY licks its wounds at the weekly low, mildly offered near 180.20 amid early Friday in Asia, as it prints the five-day losing streak. In doing so, the cross-currency pair fails to justify the downside RSI conditions while staying within a one-month-old falling wedge bullish chart formation.
That said, the 200-SMA level of around 180.55 and the 181.00 round figure restrict the immediate upside of the quote as the market awaits the UK Retail Sales for June, expected 0.2% MoM versus 0.3% prior.
Also read: GBP/USD: Cable bears need acceptance from 1.2850 and UK Retail Sales
Following that, the stated wedge’s top line, close to 181.25 at the latest, will be crucial to watch for the GBP/JPY buyers to retake control.
Even so, the 100-SMA and the monthly high, respectively near 182.00 and 184.00, may test the pair’s upside past 181.25.
In a case where the GBP/JPY remains firmer beyond 184.00, the theoretical target of the wedge breakout, near 185.75, will be in the spotlight.
Meanwhile, the monthly low of around 179.50 restricts the immediate downside of the GBP/JPY pair ahead of the stated wedge’s bottom line, near 179.30 by the press time, especially amid the below-50.0 RSI level.
Should the GBP/JPY price drops below 179.30 and gains support from downbeat UK Retail Sales, the bears may aim for the 61.8% Fibonacci retracement of June-July upside, close to 177.00.
Trend: Limited downside expected
Technical Levels: Supports and Resistances
GBPJPY currently trading at 180.16 at the time of writing. Pair opened at 180.24 and is trading with a change of -0.04% % .
| Overview | Overview.1 | |
|---|---|---|
| 0 | Today last price | 180.16 |
| 1 | Today Daily Change | -0.08 |
| 2 | Today Daily Change % | -0.04% |
| 3 | Today daily open | 180.24 |
The pair is trading below its 20 Daily moving average @ 182.19, above its 50 Daily moving average @ 177.76 , above its 100 Daily moving average @ 171.47 and above its 200 Daily moving average @ 167.54
| Trends | Trends.1 | |
|---|---|---|
| 0 | Daily SMA20 | 182.19 |
| 1 | Daily SMA50 | 177.76 |
| 2 | Daily SMA100 | 171.47 |
| 3 | Daily SMA200 | 167.54 |
The previous day high was 180.72 while the previous day low was 179.74. The daily 38.2% Fib levels comes at 180.11, expected to provide support. Similarly, the daily 61.8% fib level is at 180.34, expected to provide resistance.
Note the levels of interest below:
- Pivot support is noted at 179.74, 179.25, 178.76
- Pivot resistance is noted at 180.73, 181.21, 181.71
| Levels | Levels.1 |
|---|---|
| Previous Daily High | 180.72 |
| Previous Daily Low | 179.74 |
| Previous Weekly High | 183.23 |
| Previous Weekly Low | 179.47 |
| Previous Monthly High | 183.88 |
| Previous Monthly Low | 172.67 |
| Daily Fibonacci 38.2% | 180.11 |
| Daily Fibonacci 61.8% | 180.34 |
| Daily Pivot Point S1 | 179.74 |
| Daily Pivot Point S2 | 179.25 |
| Daily Pivot Point S3 | 178.76 |
| Daily Pivot Point R1 | 180.73 |
| Daily Pivot Point R2 | 181.21 |
| Daily Pivot Point R3 | 181.71 |
[/s2If]
Download Nehcap EAWe have two EAs that are operational on our LIVE accounts.
- EA-FIX: Check out the details here. Download EA-FIX . EA-FIX is a non-grid HFT scalper.
- EA-GROWTH: High quality low dd EA using trend grids. Download EA_GROWTHJoin Our Telegram Group
")


