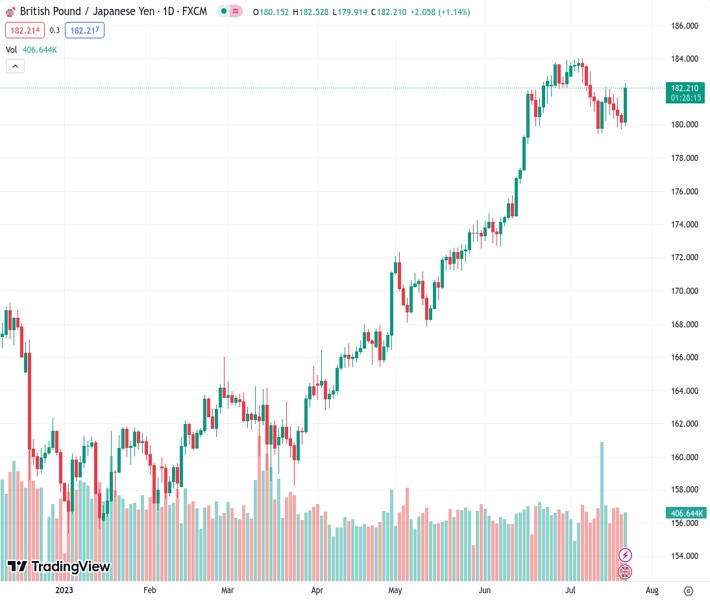
The GBPJPY pair rose above the 20-day simple moving average (SMA) and reached a peak of 182.58, wiping out losses from earlier in the week.
…
This is a premium post.
[s2If !current_user_can(access_s2member_level4)]Please register for FREE REGISTER to read full post below containing analysis. In case of any error or you think you are not able to read the full post below, please email us at support#nehcap.com [lwa][/s2If] [s2If current_user_can(access_s2member_level1)]
- The GBP/JPY cross soared above the 20-day SMA to a high of 182.58, clearing weekly losses.
The pair currently trades last at 182.218.
The previous day high was 180.72 while the previous day low was 179.74. The daily 38.2% Fib levels comes at 180.11, expected to provide support. Similarly, the daily 61.8% fib level is at 180.34, expected to provide support.
The GBP/JPY cross rose more than 1% on Friday to a high above the 20-day Simple Moving Average (SMA) and is poised to close a weekly gain. The JPY faced severe selling pressure amid dovish bets on the Bank of Japan (BoJ) before next week’s meeting, while the GBP strengthened on solid Retail Sales figures.
Retail Sales from the UK in June rose more than the expectations. The headline figure came in at 0.7% MoM vs the 0.2% expected improvement from the previous 0.1% and provided some support to the GBP.
Regarding the Bank of England’s (BoE) next steps, markets are discounting low 45% odds of a 50 basis point (bps) hike following the soft inflation figures reported on Wednesday and foresee 25 basis point hikes in September, November and February 2024, which would see the terminal rate at 5.75%, lower than last week’s estimates of 6.5%.
On the Japanese side, June inflation data showed that the National Consumer Price Index (CPI) dropped to 3.3% YoY, below the 3.5% expected, while the Core measure remained steady at 4.2% YoY, just as expected.
Ahead of next week’s meeting, according to Reuters, the BoJ will maintain its Yield Control Curve (YCC) policy as the bank considers that inflation is rising but the key is whether the increase is sustainable. In that sense, policy divergences between the BoE and the BoJ is applying selling pressure on the JPY.
The daily chart indicates a neutral to bullish outlook for the short term. The indicators show resilience, with the Relative Strength Index (RSI) positioning jumping above the midline, pointing north. At the same time, the Moving Average Convergence Divergence (MACD) prints subtle red bars, indicating a fading selling momentum. Looking at the bigger picture, the cross remains well-positioned above the 100-day and 200-day Simple Moving Averages (SMA) and the pair holding above the longer-term averages indicates that the bulls have the upperhand.
Resistance levels: 182.60, 183.00, 184.00
Support levels: 180.00. 179.50, 179.00.
Technical Levels: Supports and Resistances
GBPJPY currently trading at 182.36 at the time of writing. Pair opened at 180.24 and is trading with a change of 1.18 % .
| Overview | Overview.1 | |
|---|---|---|
| 0 | Today last price | 182.36 |
| 1 | Today Daily Change | 2.12 |
| 2 | Today Daily Change % | 1.18 |
| 3 | Today daily open | 180.24 |
The pair remains strongly bullish on the daily timeframe. It trades above its 20 SMA @ 182.19, 50 SMA 177.76, 100 SMA @ 171.47 and 200 SMA @ 167.54.
| Trends | Trends.1 | |
|---|---|---|
| 0 | Daily SMA20 | 182.19 |
| 1 | Daily SMA50 | 177.76 |
| 2 | Daily SMA100 | 171.47 |
| 3 | Daily SMA200 | 167.54 |
The previous day high was 180.72 while the previous day low was 179.74. The daily 38.2% Fib levels comes at 180.11, expected to provide support. Similarly, the daily 61.8% fib level is at 180.34, expected to provide support.
Note the levels of interest below:
- Pivot support is noted at 179.74, 179.25, 178.76
- Pivot resistance is noted at 180.73, 181.21, 181.71
| Levels | Levels.1 |
|---|---|
| Previous Daily High | 180.72 |
| Previous Daily Low | 179.74 |
| Previous Weekly High | 183.23 |
| Previous Weekly Low | 179.47 |
| Previous Monthly High | 183.88 |
| Previous Monthly Low | 172.67 |
| Daily Fibonacci 38.2% | 180.11 |
| Daily Fibonacci 61.8% | 180.34 |
| Daily Pivot Point S1 | 179.74 |
| Daily Pivot Point S2 | 179.25 |
| Daily Pivot Point S3 | 178.76 |
| Daily Pivot Point R1 | 180.73 |
| Daily Pivot Point R2 | 181.21 |
| Daily Pivot Point R3 | 181.71 |
[/s2If]
Download Nehcap EAWe have two EAs that are operational on our LIVE accounts.
- EA-FIX: Check out the details here. Download EA-FIX . EA-FIX is a non-grid HFT scalper.
- EA-GROWTH: High quality low dd EA using trend grids. Download EA_GROWTHJoin Our Telegram Group
")


