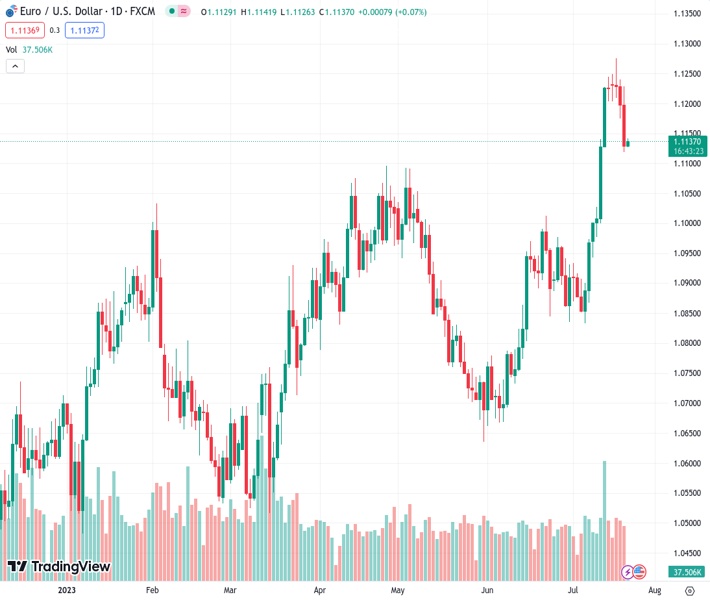
The EURUSD pair has reached a level of 1.11365 and is preparing for its first weekly decline in four weeks. It is currently moving around the lowest point of the week following three consecutive days of losses. Nehcap’s perspective is that there is not much potential for significant gains in the near future.
…
This is a premium post.
[s2If !current_user_can(access_s2member_level4)]Please register for FREE REGISTER to read full post below containing analysis. In case of any error or you think you are not able to read the full post below, please email us at support#nehcap.com [lwa][/s2If] [s2If current_user_can(access_s2member_level1)]
- EUR/USD braces for the first weekly loss in four, dribbles around the weekly bottom after three-day losing streak.
The pair currently trades last at 1.11365.
The previous day high was 1.1229 while the previous day low was 1.1118. The daily 38.2% Fib levels comes at 1.1161, expected to provide resistance. Similarly, the daily 61.8% fib level is at 1.1187, expected to provide resistance.
EUR/USD licks its wounds during the first negative week in four, clings to mild gains near 1.1130-40 amid early Friday morning in Europe, as market players struggle for clear directions ahead of next week’s monetary policy meetings of the European Central Bank and Federal Reserve (Fed).
Apart from the pre-event caution, the Euro pair also justifies a lack of major data/events, as well as the mixed concerns about the respective central banks while confusing the traders.
Also read: EUR/USD licks its wounds above 1.1100 after refreshing weekly low on strong US Dollar
Even so, the 10-day Exponential Moving Average (EMA) restricts the immediate downside of the EUR/USD pair near the 1.1130 level, especially amid the firmer RSI (14) line, not overbought.
That said, the previous support line from early February, now immediate resistance around 1.1140, guards the immediate upside of the Euro pair.
Following that, multiple levels near 1.1200 and 1.1230 can prod the EUR/USD bulls before directing it to the 1.1280 resistance area comprising technical swings marked during late 2021 and early 2022.
On the flip side, a daily closing beneath the 10-EMA level of 1.1130 isn’t an open invitation to the EUR/USD bears as the nine-week-old resistance-turned-support line, near 1.1100 at the latest, challenges the pair’s further downside.
In a case where the Euro sellers keep the reins past 1.1100, the 50-EMA level of around 1.0960 will act as the last defense of the bulls before directing the price to the monthly low of 1.0833.
Trend: Limited upside expected
Technical Levels: Supports and Resistances
EURUSD currently trading at 1.1136 at the time of writing. Pair opened at 1.113 and is trading with a change of 0.05% % .
| Overview | Overview.1 | |
|---|---|---|
| 0 | Today last price | 1.1136 |
| 1 | Today Daily Change | 0.0006 |
| 2 | Today Daily Change % | 0.05% |
| 3 | Today daily open | 1.113 |
The pair remains strongly bullish on the daily timeframe. It trades above its 20 SMA @ 1.1017, 50 SMA 1.0888, 100 SMA @ 1.0878 and 200 SMA @ 1.0682.
| Trends | Trends.1 | |
|---|---|---|
| 0 | Daily SMA20 | 1.1017 |
| 1 | Daily SMA50 | 1.0888 |
| 2 | Daily SMA100 | 1.0878 |
| 3 | Daily SMA200 | 1.0682 |
The previous day high was 1.1229 while the previous day low was 1.1118. The daily 38.2% Fib levels comes at 1.1161, expected to provide resistance. Similarly, the daily 61.8% fib level is at 1.1187, expected to provide resistance.
Note the levels of interest below:
- Pivot support is noted at 1.1089, 1.1048, 1.0978
- Pivot resistance is noted at 1.12, 1.127, 1.131
| Levels | Levels.1 |
|---|---|
| Previous Daily High | 1.1229 |
| Previous Daily Low | 1.1118 |
| Previous Weekly High | 1.1245 |
| Previous Weekly Low | 1.0944 |
| Previous Monthly High | 1.1012 |
| Previous Monthly Low | 1.0662 |
| Daily Fibonacci 38.2% | 1.1161 |
| Daily Fibonacci 61.8% | 1.1187 |
| Daily Pivot Point S1 | 1.1089 |
| Daily Pivot Point S2 | 1.1048 |
| Daily Pivot Point S3 | 1.0978 |
| Daily Pivot Point R1 | 1.1200 |
| Daily Pivot Point R2 | 1.1270 |
| Daily Pivot Point R3 | 1.1310 |
[/s2If]
Download Nehcap EAWe have two EAs that are operational on our LIVE accounts.
- EA-FIX: Check out the details here. Download EA-FIX . EA-FIX is a non-grid HFT scalper.
- EA-GROWTH: High quality low dd EA using trend grids. Download EA_GROWTHJoin Our Telegram Group
")


