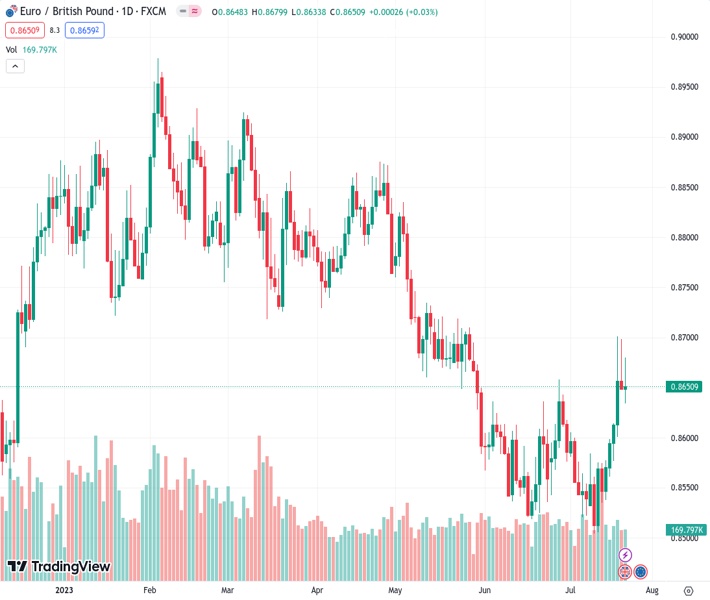
The currency pair EURGBP, currently at a rate of 0.86527, is unable to successfully exceed the 100 and 200-day Exponential Moving Averages (EMAs), positioned at 0.8664 and 0.8679 respectively, following a peak at 0.8700, which was the highest point in the past two months.
…
This is a premium post.
[s2If !current_user_can(access_s2member_level4)]Please register for FREE REGISTER to read full post below containing analysis. In case of any error or you think you are not able to read the full post below, please email us at support#nehcap.com [lwa][/s2If] [s2If current_user_can(access_s2member_level1)]
- EUR/GBP fails to decisively break above the 100 and 200-day EMAs at 0.8664 and 0.8679, respectively, after hitting a two-month high at 0.8700.
The pair currently trades last at 0.86527.
The previous day high was 0.8698 while the previous day low was 0.8649. The daily 38.2% Fib levels comes at 0.8668, expected to provide resistance. Similarly, the daily 61.8% fib level is at 0.8679, expected to provide resistance.
The EUR/GBP finished Friday’s session almost flat, failing to decisively break above the 100 and 200-day Exponential Moving Averages (EMAs), each at 0.8664 and 0.8679, respectively after the cross hit a new two-month high at 0.8700. As we head into the weekend, the EUR/GBP is trading at 0.8650, gains 0.03%.
With EUR/GBP remaining unable to breach the 0.8700 figure, the Euro (EUR) remains exposed to selling pressure, but the next week’s upcoming monetary policy meeting of the European Central Bank (ECB) could lend a lifeline to hover around the current exchange rate, as it happened on Thursday and Friday.
If EUR/GBP pullbacks, the first support would be the 50-day EMA at 0.8619, followed by the 0.8600 mark. If the cross extends its drop past those two levels, it’s almost certain that it would drop past the 0-day EMA at 0.8594, with sellers eying the July 10 high at 0.8584, followed by the year-to-date (YTD) low of 0.8504.
Conversely, if EUR/GBP breaks above 0.8700, the EUR/GBP’s next resistance level would be the May 11 high at 0.8734, followed by a resistance trendline drawn from the YTD high at 0.8978 that passes at around 0.8740/50. A breach of the latter will expose the 0.8800 mark.
Technical Levels: Supports and Resistances
EURGBP currently trading at 0.8657 at the time of writing. Pair opened at 0.865 and is trading with a change of 0.08 % .
| Overview | Overview.1 | |
|---|---|---|
| 0 | Today last price | 0.8657 |
| 1 | Today Daily Change | 0.0007 |
| 2 | Today Daily Change % | 0.0800 |
| 3 | Today daily open | 0.8650 |
The pair is trading above its 20 Daily moving average @ 0.8582, above its 50 Daily moving average @ 0.8607 , below its 100 Daily moving average @ 0.8704 and below its 200 Daily moving average @ 0.873
| Trends | Trends.1 | |
|---|---|---|
| 0 | Daily SMA20 | 0.8582 |
| 1 | Daily SMA50 | 0.8607 |
| 2 | Daily SMA100 | 0.8704 |
| 3 | Daily SMA200 | 0.8730 |
The previous day high was 0.8698 while the previous day low was 0.8649. The daily 38.2% Fib levels comes at 0.8668, expected to provide resistance. Similarly, the daily 61.8% fib level is at 0.8679, expected to provide resistance.
Note the levels of interest below:
- Pivot support is noted at 0.8633, 0.8616, 0.8583
- Pivot resistance is noted at 0.8683, 0.8715, 0.8732
| Levels | Levels.1 |
|---|---|
| Previous Daily High | 0.8698 |
| Previous Daily Low | 0.8649 |
| Previous Weekly High | 0.8584 |
| Previous Weekly Low | 0.8504 |
| Previous Monthly High | 0.8658 |
| Previous Monthly Low | 0.8518 |
| Daily Fibonacci 38.2% | 0.8668 |
| Daily Fibonacci 61.8% | 0.8679 |
| Daily Pivot Point S1 | 0.8633 |
| Daily Pivot Point S2 | 0.8616 |
| Daily Pivot Point S3 | 0.8583 |
| Daily Pivot Point R1 | 0.8683 |
| Daily Pivot Point R2 | 0.8715 |
| Daily Pivot Point R3 | 0.8732 |
[/s2If]
Download Nehcap EAWe have two EAs that are operational on our LIVE accounts.
- EA-FIX: Check out the details here. Download EA-FIX . EA-FIX is a non-grid HFT scalper.
- EA-GROWTH: High quality low dd EA using trend grids. Download EA_GROWTHJoin Our Telegram Group
")


