The Consumer Price Index (CPI) in Japan for June shows a year-on-year increase of 3.3%, which is slightly higher than the previous 3.2% rate. However, it is lower than the expected 3.5% increase.
…
This is a premium post.
[s2If !current_user_can(access_s2member_level4)]Please register for FREE REGISTER to read full post below containing analysis. In case of any error or you think you are not able to read the full post below, please email us at support#nehcap.com [lwa][/s2If] [s2If current_user_can(access_s2member_level1)]
- Japan’s Consumer Price Index (CPI) for June reports a YoY increase of 3.3%, slightly above the previous 3.2% figure, but falls short of the anticipated 3.5%.
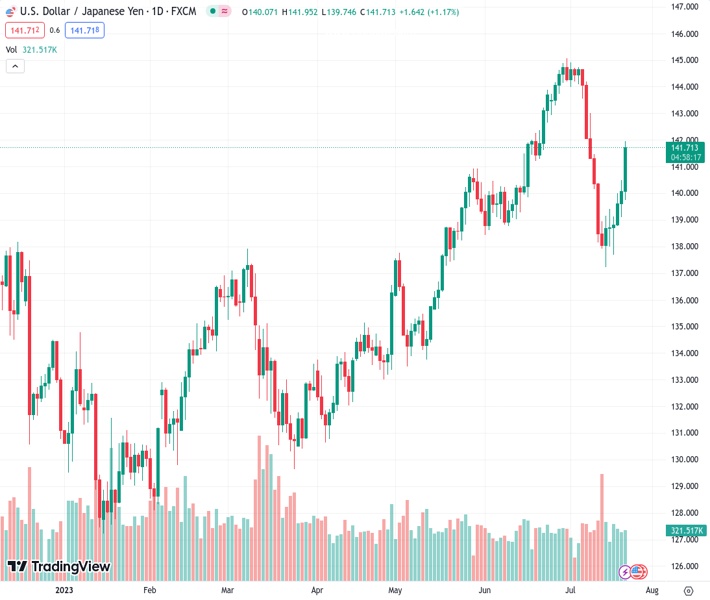
The pair currently trades last at 141.740.
The previous day high was 140.5 while the previous day low was 139.11. The daily 38.2% Fib levels comes at 139.97, expected to provide support. Similarly, the daily 61.8% fib level is at 139.64, expected to provide support.
USD/JPY rallied back above the 141.00 figure after rumors the Bank of Japan (BoJ) would not change its Yield Curve Control (YCC) emerged, spurring an upward reaction in the USD/JPY due to Japanese Yen (JPY) softness. The USD/JPY is exchanging hands at 141.71 after diving as low as 139.74.
News emerging during the Asian session spurred JPY’s weakness on Reuters sources, saying the BoJ would stick to its YCC program and maintain its dovish stance. That comes after an earlier report that in Japan exceeded estimates by a tick, seen by traders as data that could trigger a reaction by the BoJ. The Consumer Price Index (CPI) for June came at 3.3% YoY, above the prior’s 3.2% reading but failed to overcome forecasts of 3.5%. Core CPI rose by 3.3% YoY, aligned with projections and above May’s number.
The USD/JPY seesawed around 140.00 throughout most of the Asian session before the Reuters report surfaced.
On the US front, data revealed during the week showed the economy is still resilient, despite Retail Sales slowing to 0.2%, below May’s 0.5%. Thursday’s US Initial Jobless Claims report for the week ending July 15 posted 228K unemployment fillings, below the 239K estimated, sparking fears the US Federal Reserve (Fed) might react to the numbers and increase rates past the following week’s monetary policy decision.
The CME FedWatch Tool, which tracks interest rate probabilities for the Fed, sees a 99.8% chance of a quarter of a percent hike on July 26, while for September, expects no change, and for November, odds moved from below 20% last week’s, to 28.0% as of writing.
To conclude, given the interest rate differentials, the USD/JPY uptrend might continue in the near term. But next week’s could be volatile, with the Fed and the BoJ set to deliver an update on their monetary policy. A hawkish surprise by the BoJ could rock the markets sharply, while the Fed is expected to maintain its “higher for longer” bias.
From a technical standpoint, the USD/JPY pair is set to continue upward biased, reclaiming during the session the Tenkan and Kijun-Sen level, with traders setting their eyes on the 142.00 mark. A breach of that level would expose last November’s 22 daily high at 142.24, followed by the top of the Ichimoku Cloud (Kumo) at 142.83, ahead of 143.00. Conversely, if USD/JPY drops below the Kijun-Sen level of 141.15, further downward action is expected, with the 20-day Exponential Moving Average (EMA) lying at 140.80, on top of the Senkou Span A level at 140.37.
Technical Levels: Supports and Resistances
USDJPY currently trading at 141.63 at the time of writing. Pair opened at 140.08 and is trading with a change of 1.11 % .
| Overview | Overview.1 | |
|---|---|---|
| 0 | Today last price | 141.63 |
| 1 | Today Daily Change | 1.55 |
| 2 | Today Daily Change % | 1.11 |
| 3 | Today daily open | 140.08 |
The pair is trading below its 20 Daily moving average @ 141.96, above its 50 Daily moving average @ 140.51 , above its 100 Daily moving average @ 137.14 and above its 200 Daily moving average @ 136.95
| Trends | Trends.1 | |
|---|---|---|
| 0 | Daily SMA20 | 141.96 |
| 1 | Daily SMA50 | 140.51 |
| 2 | Daily SMA100 | 137.14 |
| 3 | Daily SMA200 | 136.95 |
The previous day high was 140.5 while the previous day low was 139.11. The daily 38.2% Fib levels comes at 139.97, expected to provide support. Similarly, the daily 61.8% fib level is at 139.64, expected to provide support.
Note the levels of interest below:
- Pivot support is noted at 139.29, 138.51, 137.91
- Pivot resistance is noted at 140.68, 141.28, 142.07
| Levels | Levels.1 |
|---|---|
| Previous Daily High | 140.50 |
| Previous Daily Low | 139.11 |
| Previous Weekly High | 143.00 |
| Previous Weekly Low | 137.24 |
| Previous Monthly High | 145.07 |
| Previous Monthly Low | 138.43 |
| Daily Fibonacci 38.2% | 139.97 |
| Daily Fibonacci 61.8% | 139.64 |
| Daily Pivot Point S1 | 139.29 |
| Daily Pivot Point S2 | 138.51 |
| Daily Pivot Point S3 | 137.91 |
| Daily Pivot Point R1 | 140.68 |
| Daily Pivot Point R2 | 141.28 |
| Daily Pivot Point R3 | 142.07 |
[/s2If]
Download Nehcap EAWe have two EAs that are operational on our LIVE accounts.
- EA-FIX: Check out the details here. Download EA-FIX . EA-FIX is a non-grid HFT scalper.
- EA-GROWTH: High quality low dd EA using trend grids. Download EA_GROWTHJoin Our Telegram Group
")


