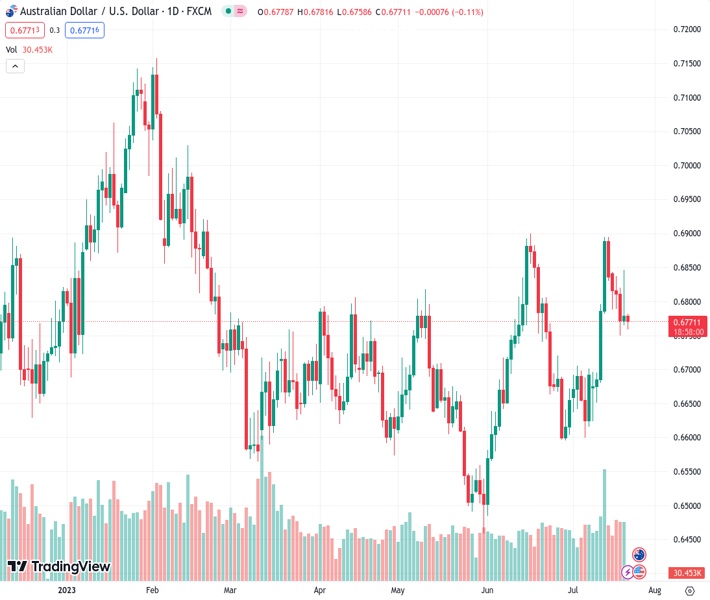
The AUDUSD pair, currently trading at 0.67696, has experienced a decline below the 50-day Exponential Moving Average (EMA) as well as a support line that has been in place for two weeks. This movement is aimed at attracting sellers. According to Nehcap’s perspective, there is an anticipation for more downward movement in the pair.
…
This is a premium post.
[s2If !current_user_can(access_s2member_level4)]Please register for FREE REGISTER to read full post below containing analysis. In case of any error or you think you are not able to read the full post below, please email us at support#nehcap.com [lwa][/s2If] [s2If current_user_can(access_s2member_level1)]
- AUD/USD slides beneath 50-EMA, fortnight-old support line to lure sellers.
The pair currently trades last at 0.67696.
The previous day high was 0.6847 while the previous day low was 0.6766. The daily 38.2% Fib levels comes at 0.6816, expected to provide resistance. Similarly, the daily 61.8% fib level is at 0.6797, expected to provide resistance.
AUD/USD prints mild losses around 0.6775-70 as it reverses the previous day’s corrective bounce amid Friday’s Asian session.
The Aussie pair’s latest weakness could be linked to the downside break of the 50-bar Exponential Moving Average (EMA) and a two-week-long rising support line. Adding strength to the downside bias is the market’s cautious mood, as well as bearish MACD signals and a steady RSI (14) line.
With this, the AUD/USD bears appear well set to target the 0.6730 support confluence comprising the 200-EMA and 38.2% Fibonacci retracement of its May 31 to June 16 upside.
However, the quote’s downside past 0.6730 has multiple supports to conquer before convincing the bears. Among them, an upward-sloping trend line from June 05, near 0.6610 at the latest, gains major attention.
On the flip side, the support-turned-resistance and the 50-EMA, around 0.6780 by the press time, restrict the immediate upside of the AUD/USD pair.
Following that, a horizontal area comprising multiple levels marked since mid-June, near 0.6830-35, will be an important hurdle to watch for the bulls.
Above all, the double tops around 0.6900 appears a tough nut to crack for the Aussie pair buyers.
Trend: Further downside expected
Technical Levels: Supports and Resistances
AUDUSD currently trading at 0.6772 at the time of writing. Pair opened at 0.6779 and is trading with a change of -0.10% % .
| Overview | Overview.1 | |
|---|---|---|
| 0 | Today last price | 0.6772 |
| 1 | Today Daily Change | -0.0007 |
| 2 | Today Daily Change % | -0.10% |
| 3 | Today daily open | 0.6779 |
The pair remains strongly bullish on the daily timeframe. It trades above its 20 SMA @ 0.6716, 50 SMA 0.6689, 100 SMA @ 0.6687 and 200 SMA @ 0.6715.
| Trends | Trends.1 | |
|---|---|---|
| 0 | Daily SMA20 | 0.6716 |
| 1 | Daily SMA50 | 0.6689 |
| 2 | Daily SMA100 | 0.6687 |
| 3 | Daily SMA200 | 0.6715 |
The previous day high was 0.6847 while the previous day low was 0.6766. The daily 38.2% Fib levels comes at 0.6816, expected to provide resistance. Similarly, the daily 61.8% fib level is at 0.6797, expected to provide resistance.
Note the levels of interest below:
- Pivot support is noted at 0.6747, 0.6716, 0.6666
- Pivot resistance is noted at 0.6829, 0.6878, 0.691
| Levels | Levels.1 |
|---|---|
| Previous Daily High | 0.6847 |
| Previous Daily Low | 0.6766 |
| Previous Weekly High | 0.6895 |
| Previous Weekly Low | 0.6624 |
| Previous Monthly High | 0.6900 |
| Previous Monthly Low | 0.6484 |
| Daily Fibonacci 38.2% | 0.6816 |
| Daily Fibonacci 61.8% | 0.6797 |
| Daily Pivot Point S1 | 0.6747 |
| Daily Pivot Point S2 | 0.6716 |
| Daily Pivot Point S3 | 0.6666 |
| Daily Pivot Point R1 | 0.6829 |
| Daily Pivot Point R2 | 0.6878 |
| Daily Pivot Point R3 | 0.6910 |
[/s2If]
Download Nehcap EAWe have two EAs that are operational on our LIVE accounts.
- EA-FIX: Check out the details here. Download EA-FIX . EA-FIX is a non-grid HFT scalper.
- EA-GROWTH: High quality low dd EA using trend grids. Download EA_GROWTHJoin Our Telegram Group
")


