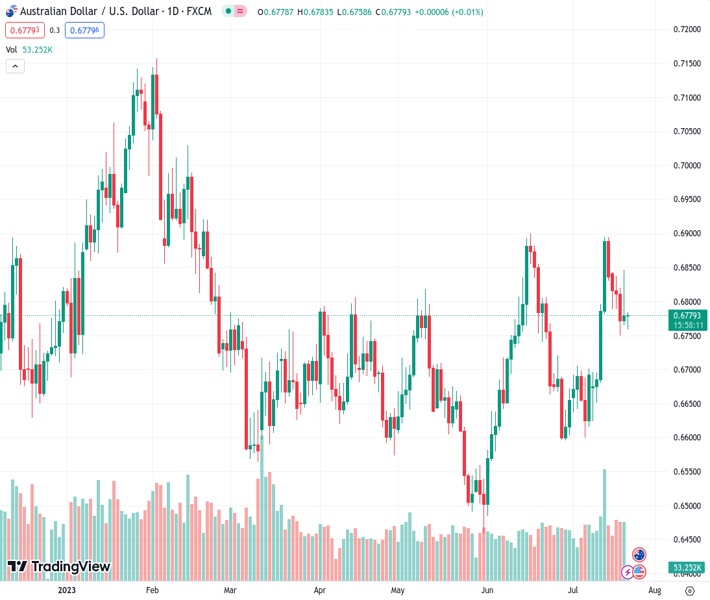
The AUDUSD pair, currently at 0.67788, rebounds from slight losses during the day and gains support due to a calm performance of the USD.
…
This is a premium post.
[s2If !current_user_can(access_s2member_level4)]Please register for FREE REGISTER to read full post below containing analysis. In case of any error or you think you are not able to read the full post below, please email us at support#nehcap.com [lwa][/s2If] [s2If current_user_can(access_s2member_level1)]
- AUD/USD reverses modest intraday losses and draws support from subdued USD price action.
The pair currently trades last at 0.67788.
The previous day high was 0.6847 while the previous day low was 0.6766. The daily 38.2% Fib levels comes at 0.6816, expected to provide resistance. Similarly, the daily 61.8% fib level is at 0.6797, expected to provide resistance.
The AUD/USD pair extends the previous day’s sharp retracement slide from the vicinity of the 0.6850 area and continues losing ground through the Asian session on Friday. Spot prices, however, manage to recover a few pips from the daily low and currently trade with a slight negative bias, around the 0.6770-0.6775 region, down less than 0.10% for the day.
The overnight slump in the US technology stocks and a generally softer tone around the Asian equity markets turn out to be a key factor weighing on the risk-sensitive Australian Dollar (AUD). Concerns over slowing growth in China, along with the worsening US-China relations and geopolitical risks, temper investors’ appetite for riskier assets. However, hopes that China will roll out more stimulus measures to buoy a slowing economic recovery, along with rising bets for more interest rate hikes by the Reserve Bank of Australia (RBA), help limit losses for the AUD/USD pair.
China’s top economic planner – the National Development and Reform Commission (NDRC) – unveiled new measures on Friday, aimed at promoting local, particularly in the automobile and consumer electronics sectors. Moreover, the government vowed to shore up local consumption to support the economic recovery, especially after data this week showed that growth in China slowed significantly during the second quarter. Meanwhile, the upbeat jobs report released from Australia on Thursday puts pressure on the RBA to act further.
Apart from this, subdued US Dollar (USD) price action assists the AUD/USD pair to find some support ahead of mid-0.6700s, or the weekly low touched on Wednesday. In fact, the USD Index (DXY), which tracks the Greenback against a basket of currencies, is seen consolidating the overnight gains to over a one-week high and for now, seems to have stalled the recent recovery from its lowest level since April 2022 set earlier this week. The downside for the USD, however, seems limited in the wake of the better-than-expected US macro data released on Thursday.
The US Labor Department reported that Initial Jobless Claims dropped to a seasonally adjusted 228K during the week ended July 15. The data continues to flash strength in the US labour market and reaffirms market bets for a 25 bps lift-off at the upcoming FOMC meeting on July 25-26. Furthermore, investors remain sceptic about whether the Fed will commit to a more dovish policy stance or stick to its forecast for a 50 bps rate hike this year. This led to the overnight solid bounce in the US Treasury bond yields and lends some support to the Greenback.
In the absence of any relevant market-moving economic data from the US, the aforementioned fundamental backdrop warrants some caution before placing aggressive directional bets around the AUD/USD pair. Traders might also prefer to move to the sidelines and wait for the outcome of the highly-anticipated two-day FOMC policy meeting, scheduled to be announced next Wednesday. Nevertheless, spot prices seem poised to end in the red for the first time in the previous three weeks and remain at the mercy of the USD price dynamics.
Technical Levels: Supports and Resistances
AUDUSD currently trading at 0.6776 at the time of writing. Pair opened at 0.6779 and is trading with a change of -0.04 % .
| Overview | Overview.1 | |
|---|---|---|
| 0 | Today last price | 0.6776 |
| 1 | Today Daily Change | -0.0003 |
| 2 | Today Daily Change % | -0.0400 |
| 3 | Today daily open | 0.6779 |
The pair remains strongly bullish on the daily timeframe. It trades above its 20 SMA @ 0.6716, 50 SMA 0.6689, 100 SMA @ 0.6687 and 200 SMA @ 0.6715.
| Trends | Trends.1 | |
|---|---|---|
| 0 | Daily SMA20 | 0.6716 |
| 1 | Daily SMA50 | 0.6689 |
| 2 | Daily SMA100 | 0.6687 |
| 3 | Daily SMA200 | 0.6715 |
The previous day high was 0.6847 while the previous day low was 0.6766. The daily 38.2% Fib levels comes at 0.6816, expected to provide resistance. Similarly, the daily 61.8% fib level is at 0.6797, expected to provide resistance.
Note the levels of interest below:
- Pivot support is noted at 0.6747, 0.6716, 0.6666
- Pivot resistance is noted at 0.6829, 0.6878, 0.691
| Levels | Levels.1 |
|---|---|
| Previous Daily High | 0.6847 |
| Previous Daily Low | 0.6766 |
| Previous Weekly High | 0.6895 |
| Previous Weekly Low | 0.6624 |
| Previous Monthly High | 0.6900 |
| Previous Monthly Low | 0.6484 |
| Daily Fibonacci 38.2% | 0.6816 |
| Daily Fibonacci 61.8% | 0.6797 |
| Daily Pivot Point S1 | 0.6747 |
| Daily Pivot Point S2 | 0.6716 |
| Daily Pivot Point S3 | 0.6666 |
| Daily Pivot Point R1 | 0.6829 |
| Daily Pivot Point R2 | 0.6878 |
| Daily Pivot Point R3 | 0.6910 |
[/s2If]
Download Nehcap EAWe have two EAs that are operational on our LIVE accounts.
- EA-FIX: Check out the details here. Download EA-FIX . EA-FIX is a non-grid HFT scalper.
- EA-GROWTH: High quality low dd EA using trend grids. Download EA_GROWTHJoin Our Telegram Group
")


