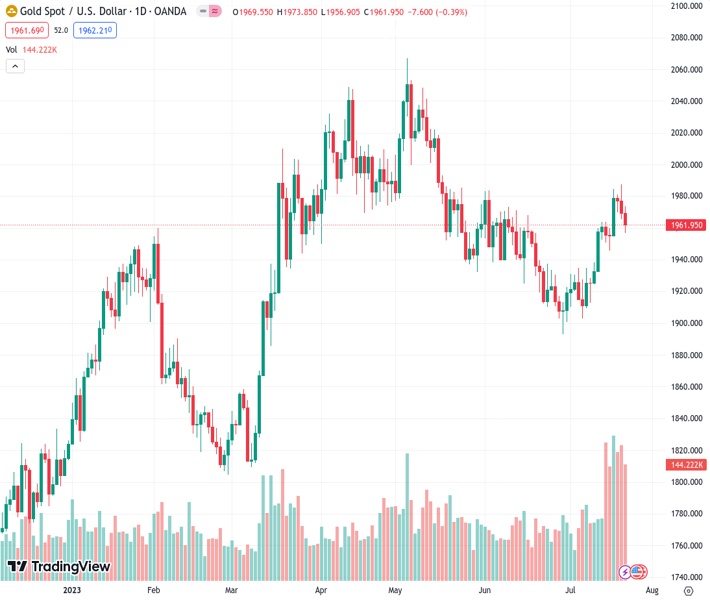
Gold prices for XAUUSD dropped close to the 100-day Simple Moving Average at around $1,960, but managed to maintain their gains for the week.
…
This is a premium post.
[s2If !current_user_can(access_s2member_level4)]Please register for FREE REGISTER to read full post below containing analysis. In case of any error or you think you are not able to read the full post below, please email us at support#nehcap.com [lwa][/s2If] [s2If current_user_can(access_s2member_level1)]
- XAU/USD fell near the 100-day SMA near $1,960 but held weekly gains.
The pair currently trades last at 1961.74.
The previous day high was 1987.54 while the previous day low was 1965.41. The daily 38.2% Fib levels comes at 1973.86, expected to provide resistance. Similarly, the daily 61.8% fib level is at 1979.09, expected to provide resistance.
At the end of the week, the XAU/USD traded near the 100-day Simple Moving Average of $1,962, experiencing a 0.30% decline but recorded a weekly gain, its third in a row.
The prevailing strength of the US Dollar continues to exert downward pressure on XAU/USD. Notably, the recent release of Initial Jobless Claims data by the US Department of Labor revealed a lower figure of 228,000 people filing for unemployment benefits in the second week of July, below the market expectation of 242,000. These positive employment figures reflect a robust US economy, potentially prompting the Federal Reserve (Fed) to maintain a more aggressive stance. In that sense, the US bond yield rose sharply on Thursday, boosting the USD and applying the non-yielding metal selling pressure.
Ahead of next week’s Federal Open Market (FOMC) decision, markets have practically priced in a 25 basis point (bps) hike, and robust labour market data boosted the odds of an additional hike past July. However, those odds remain low, near 30%. In addition, Chair Powell’s presser will be closely watched as investors look for clues regarding forwards guidance.
The daily chart of XAU/USD indicates a negative market sentiment dominated by bears. The Relative Strength Index (RSI) stands in positive territory above the midline but with a negative while the Moving Average Convergence Divergence (MACD) displays fading green bars, signalling exhaustion for the bulls. In the broader context, despite the bearish momentum, the price trading above the 20, 100, and 200-day Simple Moving Average (SMA) indicates that the overall trend remains to favour the bulls.
Support levels: $1,960 (100-SMA), $1,950, $1,936 (20-day SMA).
Resistance levels: $1,970, $1,987 (monthly high), $2,000.
Technical Levels: Supports and Resistances
XAUUSD currently trading at 1961.84 at the time of writing. Pair opened at 1969.41 and is trading with a change of -0.38 % .
| Overview | Overview.1 | |
|---|---|---|
| 0 | Today last price | 1961.84 |
| 1 | Today Daily Change | -7.57 |
| 2 | Today Daily Change % | -0.38 |
| 3 | Today daily open | 1969.41 |
The pair remains strongly bullish on the daily timeframe. It trades above its 20 SMA @ 1935.1, 50 SMA 1950.09, 100 SMA @ 1959.51 and 200 SMA @ 1878.3.
| Trends | Trends.1 | |
|---|---|---|
| 0 | Daily SMA20 | 1935.10 |
| 1 | Daily SMA50 | 1950.09 |
| 2 | Daily SMA100 | 1959.51 |
| 3 | Daily SMA200 | 1878.30 |
The previous day high was 1987.54 while the previous day low was 1965.41. The daily 38.2% Fib levels comes at 1973.86, expected to provide resistance. Similarly, the daily 61.8% fib level is at 1979.09, expected to provide resistance.
Note the levels of interest below:
- Pivot support is noted at 1960.7, 1951.99, 1938.57
- Pivot resistance is noted at 1982.83, 1996.25, 2004.96
| Levels | Levels.1 |
|---|---|
| Previous Daily High | 1987.54 |
| Previous Daily Low | 1965.41 |
| Previous Weekly High | 1963.82 |
| Previous Weekly Low | 1912.74 |
| Previous Monthly High | 1983.50 |
| Previous Monthly Low | 1893.01 |
| Daily Fibonacci 38.2% | 1973.86 |
| Daily Fibonacci 61.8% | 1979.09 |
| Daily Pivot Point S1 | 1960.70 |
| Daily Pivot Point S2 | 1951.99 |
| Daily Pivot Point S3 | 1938.57 |
| Daily Pivot Point R1 | 1982.83 |
| Daily Pivot Point R2 | 1996.25 |
| Daily Pivot Point R3 | 2004.96 |
[/s2If]
Download Nehcap EAWe have two EAs that are operational on our LIVE accounts.
- EA-FIX: Check out the details here. Download EA-FIX . EA-FIX is a non-grid HFT scalper.
- EA-GROWTH: High quality low dd EA using trend grids. Download EA_GROWTHJoin Our Telegram Group
")


