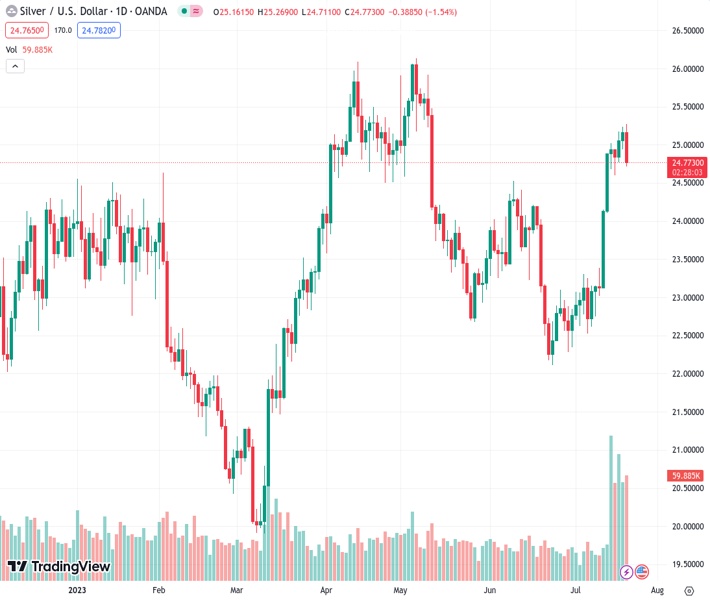
The XAGUSD, which was at 24.775, experienced a decrease of over 1% on Thursday, falling beneath the $25.00 level.
…
This is a premium post.
[s2If !current_user_can(access_s2member_level4)]Please register for FREE REGISTER to read full post below containing analysis. In case of any error or you think you are not able to read the full post below, please email us at support#nehcap.com [lwa][/s2If] [s2If current_user_can(access_s2member_level1)]
- The XAG/USD dropped more than 1% on Thursday below the $25.00 mark.
The pair currently trades last at 24.775.
The previous day high was 25.24 while the previous day low was 24.94. The daily 38.2% Fib levels comes at 25.13, expected to provide resistance. Similarly, the daily 61.8% fib level is at 25.06, expected to provide resistance.
The XAG/USD Silver spot price dropped towards the $24.80 area, recording 1.28% losses on Thursday amid a recovery of the USD. Despite weak Manufacturing and Housing data, lower-than-expected Jobless Claims fueled a rise in hawkish bets on the Federal Reserve (Fed) and US Treasury yields, making the grey metal lose interest.
The US reported mid-tier data. On the negative side, the Philadelphia Federal Reserve Manufacturing survey showed worrying results as its index declined more than expected, coming in at -13 vs the consensus of -10. In addition, following Wednesday’s soft Housing data, Existing sales from the US from June also showed weakness. The figure showed a contraction of 3.3% MoM in June with a 4.16M decrease.
However, investors seem to be weighing more Jobless Claims data. For the week ending on July 14, the number of people filing for unemployment benefits came in lower than the market consensus at 228,000 vs 242,000 expected and below the previous figure of 237,000. It fueled a rise in US Treasury yields on Federal Reserve hawkish bets. The 2-year yield rose to 4.88% while the 5 and 10-year rates jumped to 4.10% and 3.84%, with all three displaying strong increases of more than 1.50%. As bond yields could be seen as the opportunity cost of holding non-yielding metals, Silver prices are retreating.
According to the daily chart, the technical outlook for the XAG/USD is neutral to bearish for the short term as bulls run out of steam. The Relative Strength Index (RSI) got rejected at the overbought threshold, while the Moving Average Convergence Divergence (MACD) prints lower green bars, indicating a lower buying pressure. However, on the bigger picture, the outlook is bullish as the price trades above the 20, 100 and 200-day Simple Moving Averages (SMA).
Support levels: $24.70, $24.50, $24.10.
Resistance levels: $25.00, $25.30,$25.00.
Technical Levels: Supports and Resistances
XAGUSD currently trading at 24.8 at the time of writing. Pair opened at 25.14 and is trading with a change of -1.35 % .
| Overview | Overview.1 | |
|---|---|---|
| 0 | Today last price | 24.80 |
| 1 | Today Daily Change | -0.34 |
| 2 | Today Daily Change % | -1.35 |
| 3 | Today daily open | 25.14 |
The pair remains strongly bullish on the daily timeframe. It trades above its 20 SMA @ 23.42, 50 SMA 23.56, 100 SMA @ 23.65 and 200 SMA @ 22.85.
| Trends | Trends.1 | |
|---|---|---|
| 0 | Daily SMA20 | 23.42 |
| 1 | Daily SMA50 | 23.56 |
| 2 | Daily SMA100 | 23.65 |
| 3 | Daily SMA200 | 22.85 |
The previous day high was 25.24 while the previous day low was 24.94. The daily 38.2% Fib levels comes at 25.13, expected to provide resistance. Similarly, the daily 61.8% fib level is at 25.06, expected to provide resistance.
Note the levels of interest below:
- Pivot support is noted at 24.98, 24.81, 24.68
- Pivot resistance is noted at 25.27, 25.4, 25.57
| Levels | Levels.1 |
|---|---|
| Previous Daily High | 25.24 |
| Previous Daily Low | 24.94 |
| Previous Weekly High | 25.02 |
| Previous Weekly Low | 22.75 |
| Previous Monthly High | 24.53 |
| Previous Monthly Low | 22.11 |
| Daily Fibonacci 38.2% | 25.13 |
| Daily Fibonacci 61.8% | 25.06 |
| Daily Pivot Point S1 | 24.98 |
| Daily Pivot Point S2 | 24.81 |
| Daily Pivot Point S3 | 24.68 |
| Daily Pivot Point R1 | 25.27 |
| Daily Pivot Point R2 | 25.40 |
| Daily Pivot Point R3 | 25.57 |
[/s2If]
Download Nehcap EAWe have two EAs that are operational on our LIVE accounts.
- EA-FIX: Check out the details here. Download EA-FIX . EA-FIX is a non-grid HFT scalper.
- EA-GROWTH: High quality low dd EA using trend grids. Download EA_GROWTHJoin Our Telegram Group
")


