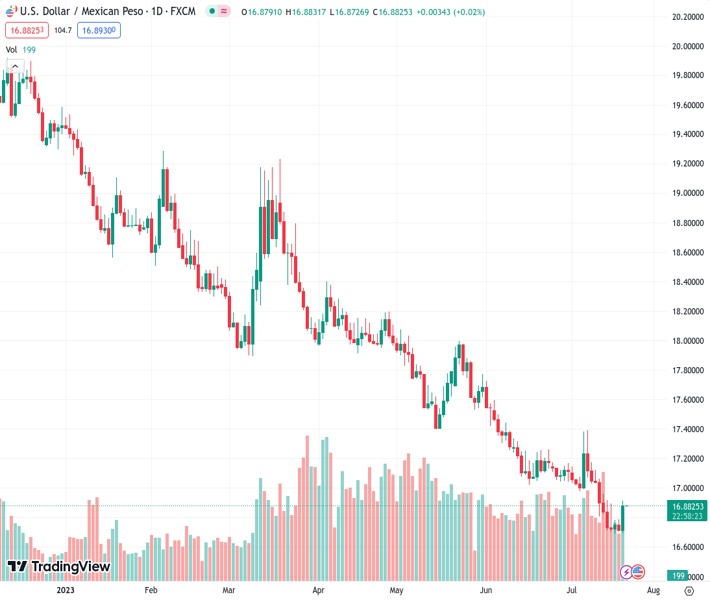
The USDMXN currency pair experienced a significant increase of over 1% on Thursday, following the release of US Initial Jobless Claims data which surpassed expectations, showing a slight decrease in claims.
…
This is a premium post.
[s2If !current_user_can(access_s2member_level4)]Please register for FREE REGISTER to read full post below containing analysis. In case of any error or you think you are not able to read the full post below, please email us at support#nehcap.com [lwa][/s2If] [s2If current_user_can(access_s2member_level1)]
- USD/MXN rose more than 1% on Thursday after US Initial Jobless Claims data came in better than expected, with claims edging lower.
The pair currently trades last at 16.8730.
The previous day high was 16.7872 while the previous day low was 16.7076. The daily 38.2% Fib levels comes at 16.738, expected to provide support. Similarly, the daily 61.8% fib level is at 16.7568, expected to provide support.
USD/MXN surged on Thursday as market sentiment turned cautious ahead of the US Federal Reserve (Fed) next week’s monetary policy meeting and on solid US jobs data. Expectations are increasing that the Fed could tighten conditions past the July meeting, causing a repricing of monetary policy. Hence, the USD/MXN is trading at 16.8785, gaining more than 1% on Tuesday, with buyers eyeing the 17.00 figure, in the near term.
The USD/MXN recovered lost ground due to Initial Jobless Claims for the last week coming below estimates of 240K, at 228K, and well below the prior’s report of 240K, signaling that expected lay-offs of US companies are not happening.
The data triggered a jump in US Treasury bond yields, consequently underpinning the US Dollar (USD). The front end of the curve, particularly the US 2-year Treasury note, gained seven basis points (bps), finishing at 4.845%. The US 10-year benchmark note yielded 3.856%, up ten bps, a tailwind for the greenback as mentioned above, which posted gains of 0.86%, as shown by the US Dollar Index (DXY).
In addition, market participants are reassessing a possible rate hike after the Fed’s meeting next week, as shown by the CME FedWatch Tool. The chances lie at 32.2% for a 25 bps, compared to 19.8% odds a week ago.
Other data showed the US housing market decelerated, as Existing Home Sales dived -3.3% in June, with sales coming at 4.16M beneath the 4.3M in May and missing 4.2M forecasts.
In the case of the Mexican Peso (MXN), the emerging market currency lost traction as the USD/MXN soared on the US data release, as the pair printed a new weekly high of 16.9145. Retail Sales for May in Mexico plunged -0.5% MoM, beneath estimates of a 0.3% expansion, while annual-based numbers decelerated from 3.8% in April to 2.6% in May.
Given the backdrop, if the Mexican economy shows soft data, that could spur outflows from the emerging market currency. That, alongside risk sentiment, could be factors vs. the MXN, as sied by analysts of Capital Economics, which noted that “Though the Mexican peso stands out among major Latin American currencies as the one that’s performed most poorly today, it’s basically a reflection of the fact that the peso seems to be quite vulnerable to deterioration in risk appetite.”
The USD/MXN daily chart shows the downtrend remains intact but at the brisk of turning neutral. To achieve that, buyers would need to regain control and lift the USD/MXN above the 20-day Exponential Moving Average (EMA) at 16.9596, followed by the 17.00 figure. Even though that would ease downward pressure on the USD/MXN, buyers must reclaim the 50-day EMA at 17.2387, followed by the May 17 daily low turned resistance at 17.4038, to pave the way for a recovery. Conversely, if USD/MXN sellers keep the pair below 17.00, that could exacerbate a drop towards 16.5000, followed by the October 2015 low of 16.3267.
Technical Levels: Supports and Resistances
USDMXN currently trading at 16.8895 at the time of writing. Pair opened at 16.7212 and is trading with a change of 1.01 % .
| Overview | Overview.1 | |
|---|---|---|
| 0 | Today last price | 16.8895 |
| 1 | Today Daily Change | 0.1683 |
| 2 | Today Daily Change % | 1.0100 |
| 3 | Today daily open | 16.7212 |
The pair remains strongly bearish on the daily time frame. It trades below the 20 SMA @ 17.0105, 50 SMA 17.2946, 100 SMA @ 17.7402 and 200 SMA @ 18.4974.
| Trends | Trends.1 | |
|---|---|---|
| 0 | Daily SMA20 | 17.0105 |
| 1 | Daily SMA50 | 17.2946 |
| 2 | Daily SMA100 | 17.7402 |
| 3 | Daily SMA200 | 18.4974 |
The previous day high was 16.7872 while the previous day low was 16.7076. The daily 38.2% Fib levels comes at 16.738, expected to provide support. Similarly, the daily 61.8% fib level is at 16.7568, expected to provide support.
Note the levels of interest below:
- Pivot support is noted at 16.6901, 16.6591, 16.6105
- Pivot resistance is noted at 16.7697, 16.8182, 16.8493
| Levels | Levels.1 |
|---|---|
| Previous Daily High | 16.7872 |
| Previous Daily Low | 16.7076 |
| Previous Weekly High | 17.1746 |
| Previous Weekly Low | 16.7167 |
| Previous Monthly High | 17.7286 |
| Previous Monthly Low | 17.0243 |
| Daily Fibonacci 38.2% | 16.7380 |
| Daily Fibonacci 61.8% | 16.7568 |
| Daily Pivot Point S1 | 16.6901 |
| Daily Pivot Point S2 | 16.6591 |
| Daily Pivot Point S3 | 16.6105 |
| Daily Pivot Point R1 | 16.7697 |
| Daily Pivot Point R2 | 16.8182 |
| Daily Pivot Point R3 | 16.8493 |
[/s2If]
Download Nehcap EAWe have two EAs that are operational on our LIVE accounts.
- EA-FIX: Check out the details here. Download EA-FIX . EA-FIX is a non-grid HFT scalper.
- EA-GROWTH: High quality low dd EA using trend grids. Download EA_GROWTHJoin Our Telegram Group
")


