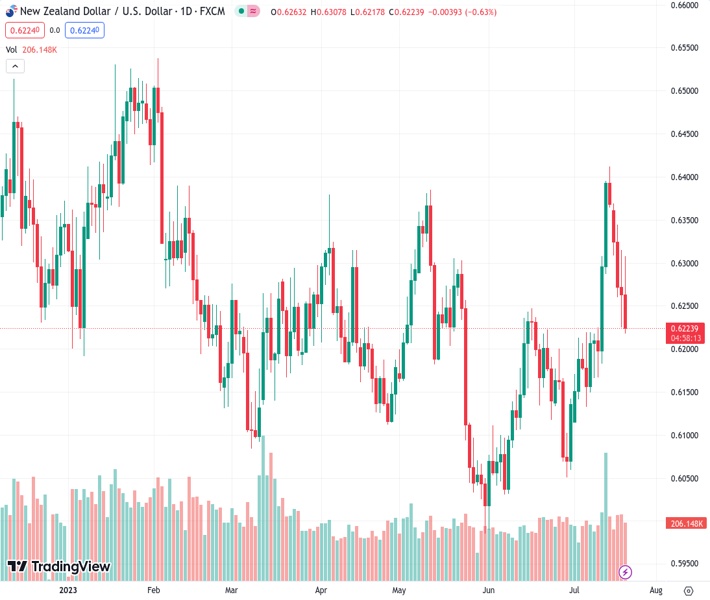
The recent report from the US Bureau of Labor Statistics indicates that the initial jobless claims were lower than anticipated, which has led to an increase in US Treasury bond yields and caused a rally in the NZDUSD pair, which is currently trading at 0.62224.
…
This is a premium post.
[s2If !current_user_can(access_s2member_level4)]Please register for FREE REGISTER to read full post below containing analysis. In case of any error or you think you are not able to read the full post below, please email us at support#nehcap.com [lwa][/s2If] [s2If current_user_can(access_s2member_level1)]
- US Bureau of Labor Statistics (BLS) report reveals lower-than-expected initial jobless claims, spurring a rally in US Treasury bond yields.
The pair currently trades last at 0.62224.
The previous day high was 0.6334 while the previous day low was 0.6225. The daily 38.2% Fib levels comes at 0.6267, expected to provide resistance. Similarly, the daily 61.8% fib level is at 0.6293, expected to provide resistance.
NZD/USD slides for the fifth consecutive day as the US Dollar (USD) strengthens on jobs data that still portrays the tightness of the labor market, triggering a reaction in US Treasury bond yields, edging higher. Therefore, the NZD/USD Is trading at 0.6229, losing 0.4%, after reaching a daily high above the 0.6300 figure.
A report by the US Bureau of Labor Statistics (BLS) showed that unemployment claims for the week ending July 15 cane lower than estimates, spurring a rally in US Treasury bond yields. Initial Jobless Claims rose by 228K, below forecasts of 240K, while Continuing Claims, which lagged the current claims week reported, jumped 33K, to 1.754 million, from 1721K.
After the data, as mentioned, the US 2 and 10-year Treasury note yields skyrocketed, 2s jumping ten basis points (bps) at 4.873, while the 10-year Treasury note followed suit, gaining ten bps at 3.852%.
Per the US bond yields reaction, the greenback rose, as shown by the US Dollar Index (DXY). The DXY, which tracks the buck’s performance against a basket of six currencies, advances 0.51%, up at 100.796, a headwind for the NZD/USD pair resulting from traders reassessing a possible Federal Reserve rate hike past the July meeting.
The CME FedWatch Tool depicts investors fully priced in a 25 bps hike in July. Nevertheless, odds for a November rate increase are lingering back on investors’ minds, with odds standing at 32.2%, higher than one week ago 19.8% chance.
On the New Zealand (NZ) front, the recent monetary policy of the Reserve Bank of New Zealand (RBNZ) witnessed the RBNZ holding rates unchanged at 5.5%, as the central bank noted that consumer spending has eased, helping to cool down inflation. The latest inflation report witnessed the Consumer Price Index (CPI) for Q2 YoY slowing from 6.7% to 6%, aligned with RBNZ’s projections.
Given the fundamental backdrop, with the Fed and RBNZ monetary policy divergences, the NZD/USD could continue to trend lower unless next month’s inflation figures in NZ shift the RBNZ’s board to take action to tame inflation.
NZD/USD buyers’ failure to conquer the 0.6300 mark exposed the pair to selling pressure, with the major prolonging its losses toward the 200-day Exponential Moving Average (EMA) at 0.6226. Of note, the pair has fallen to the latter twice in the last couple of days, but a daily close has not been achieved to shift the trend to neutral. In addition, the 20-day EMA at 0.6232 cushioned the NZD/USD’s fall, which if breaks the 0.6232/26 area, a challenge to 0.6200 is on the cards. On the other hand, if NZD/USD advances toward 0.6300, that would keep the trend intact.
Technical Levels: Supports and Resistances
NZDUSD currently trading at 0.6228 at the time of writing. Pair opened at 0.6264 and is trading with a change of -0.57 % .
| Overview | Overview.1 | |
|---|---|---|
| 0 | Today last price | 0.6228 |
| 1 | Today Daily Change | -0.0036 |
| 2 | Today Daily Change % | -0.5700 |
| 3 | Today daily open | 0.6264 |
The pair remains strongly bullish on the daily timeframe. It trades above its 20 SMA @ 0.6204, 50 SMA 0.6172, 100 SMA @ 0.6195 and 200 SMA @ 0.62.
| Trends | Trends.1 | |
|---|---|---|
| 0 | Daily SMA20 | 0.6204 |
| 1 | Daily SMA50 | 0.6172 |
| 2 | Daily SMA100 | 0.6195 |
| 3 | Daily SMA200 | 0.6200 |
The previous day high was 0.6334 while the previous day low was 0.6225. The daily 38.2% Fib levels comes at 0.6267, expected to provide resistance. Similarly, the daily 61.8% fib level is at 0.6293, expected to provide resistance.
Note the levels of interest below:
- Pivot support is noted at 0.6214, 0.6165, 0.6105
- Pivot resistance is noted at 0.6324, 0.6384, 0.6433
| Levels | Levels.1 |
|---|---|
| Previous Daily High | 0.6334 |
| Previous Daily Low | 0.6225 |
| Previous Weekly High | 0.6413 |
| Previous Weekly Low | 0.6166 |
| Previous Monthly High | 0.6250 |
| Previous Monthly Low | 0.5990 |
| Daily Fibonacci 38.2% | 0.6267 |
| Daily Fibonacci 61.8% | 0.6293 |
| Daily Pivot Point S1 | 0.6214 |
| Daily Pivot Point S2 | 0.6165 |
| Daily Pivot Point S3 | 0.6105 |
| Daily Pivot Point R1 | 0.6324 |
| Daily Pivot Point R2 | 0.6384 |
| Daily Pivot Point R3 | 0.6433 |
[/s2If]
Download Nehcap EAWe have two EAs that are operational on our LIVE accounts.
- EA-FIX: Check out the details here. Download EA-FIX . EA-FIX is a non-grid HFT scalper.
- EA-GROWTH: High quality low dd EA using trend grids. Download EA_GROWTHJoin Our Telegram Group
")


