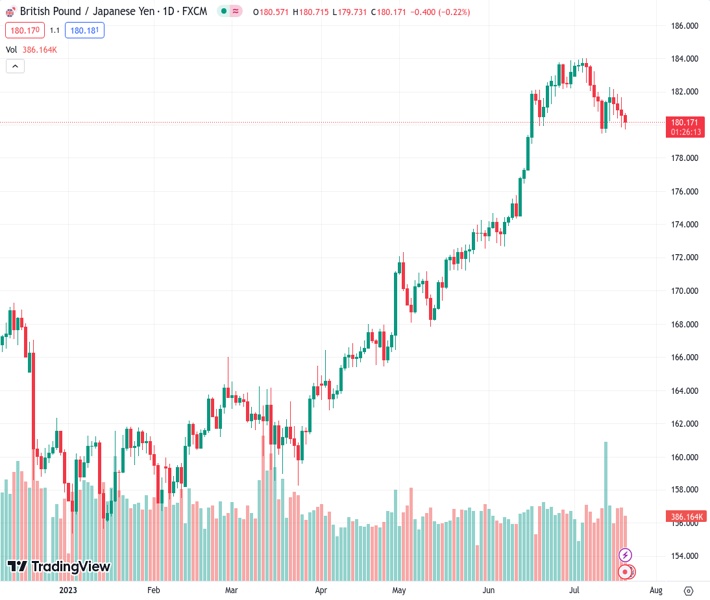
The GBPJPY is trading at a value of 180.169, experiencing a decline around the 180.20 region, marking the fourth day in a row of losses.
…
This is a premium post.
[s2If !current_user_can(access_s2member_level4)]Please register for FREE REGISTER to read full post below containing analysis. In case of any error or you think you are not able to read the full post below, please email us at support#nehcap.com [lwa][/s2If] [s2If current_user_can(access_s2member_level1)]
- GBP/JPY trades with losses at the 180.20 area, recording a fourth consecutive day of losses.
The pair currently trades last at 180.169.
The previous day high was 181.65 while the previous day low was 179.83. The daily 38.2% Fib levels comes at 180.52, expected to provide resistance. Similarly, the daily 61.8% fib level is at 180.95, expected to provide resistance.
The GBP/JPY retreated below 181.0 on Thursday as markets stay cautious ahead of Japanese inflation figures and the respective Bank of Japan (BoJ) decision next week. On the other hand, the Pound struggles to find demand following soft inflation figures.
Dovish bets continue to weigh on the GBP, but UK yields recovering may limit the Pound’s losses. Following soft inflation figures, the odds of a 50 basis points (bps) hike dropped to nearly 45%, and investors are now seeing a terminal rate of 5.75% vs last week’s 6.50%, which made British yield fall to their lowest levels since mid-June. That being said, the rates bounced back, giving some support to the GBP, but more downside may be on the horizon.
The Ministry of Finance of Japan reported poor Trade Balance data from June. Exports increased by 1.5% YoY, lower than the 2.2% expected, while imports dropped 12.9% YoY, a more significant decline than the expected 11.3%. As Exports are slowing, its likely that policymakers won’t pivot to a contractive monetary policy which could intensify the downturn.
Despite markets discounting that the BoJ will maintain its policy unchanged next week, investors will eye inflation data from Japan to be reported during the Asian session on Friday. The headline Consumer Price Index (CPI) is expected to have accelerated to 3.5% YoY in June while the Core measure decelerates slightly to 4.2%. Its worth noticing that Governor Ueda from the BoJ, hinted that the bank will pivot once inflation figures meet the bank’s forecast.
The daily chart indicates that the technical outlook for the cross is neutral to bearish, but indicators have turned flat in negative territory. The Relative Strength Index (RSI) points south near its midline, and the Moving Average Convergence Divergence (MACD) prints red flat bars indicating that the markets seem to be waiting for a catalyst.
Resistance levels: 181.00.182.12 (20-day Simple Moving Average), 183.00.
Support levels: 180.00. 179.50, 179.00.
Technical Levels: Supports and Resistances
GBPJPY currently trading at 180.2 at the time of writing. Pair opened at 180.67 and is trading with a change of -0.26 % .
| Overview | Overview.1 | |
|---|---|---|
| 0 | Today last price | 180.20 |
| 1 | Today Daily Change | -0.47 |
| 2 | Today Daily Change % | -0.26 |
| 3 | Today daily open | 180.67 |
The pair is trading below its 20 Daily moving average @ 182.3, above its 50 Daily moving average @ 177.52 , above its 100 Daily moving average @ 171.3 and above its 200 Daily moving average @ 167.47
| Trends | Trends.1 | |
|---|---|---|
| 0 | Daily SMA20 | 182.30 |
| 1 | Daily SMA50 | 177.52 |
| 2 | Daily SMA100 | 171.30 |
| 3 | Daily SMA200 | 167.47 |
The previous day high was 181.65 while the previous day low was 179.83. The daily 38.2% Fib levels comes at 180.52, expected to provide resistance. Similarly, the daily 61.8% fib level is at 180.95, expected to provide resistance.
Note the levels of interest below:
- Pivot support is noted at 179.78, 178.89, 177.96
- Pivot resistance is noted at 181.6, 182.54, 183.42
| Levels | Levels.1 |
|---|---|
| Previous Daily High | 181.65 |
| Previous Daily Low | 179.83 |
| Previous Weekly High | 183.23 |
| Previous Weekly Low | 179.47 |
| Previous Monthly High | 183.88 |
| Previous Monthly Low | 172.67 |
| Daily Fibonacci 38.2% | 180.52 |
| Daily Fibonacci 61.8% | 180.95 |
| Daily Pivot Point S1 | 179.78 |
| Daily Pivot Point S2 | 178.89 |
| Daily Pivot Point S3 | 177.96 |
| Daily Pivot Point R1 | 181.60 |
| Daily Pivot Point R2 | 182.54 |
| Daily Pivot Point R3 | 183.42 |
[/s2If]
Download Nehcap EAWe have two EAs that are operational on our LIVE accounts.
- EA-FIX: Check out the details here. Download EA-FIX . EA-FIX is a non-grid HFT scalper.
- EA-GROWTH: High quality low dd EA using trend grids. Download EA_GROWTHJoin Our Telegram Group
")


