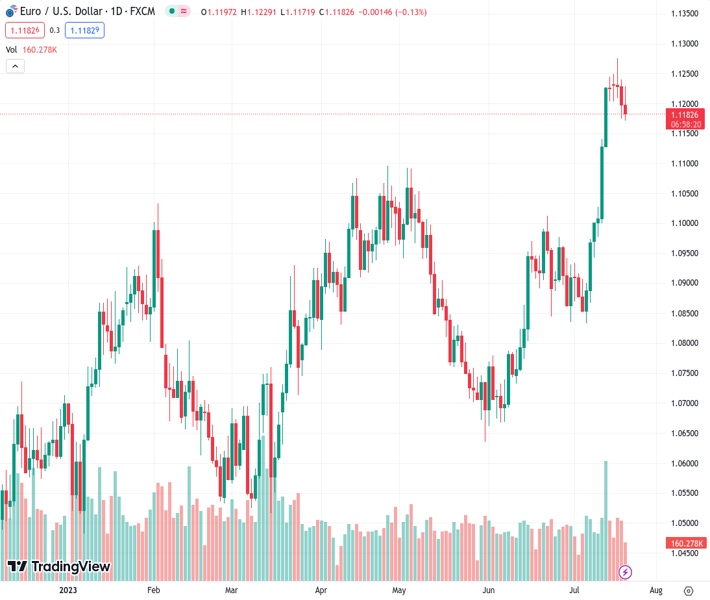
The EURUSD currency pair at a rate of 1.11825 is experiencing a downward correction and revisiting the 1.1170 region.
…
This is a premium post.
[s2If !current_user_can(access_s2member_level4)]Please register for FREE REGISTER to read full post below containing analysis. In case of any error or you think you are not able to read the full post below, please email us at support#nehcap.com [lwa][/s2If] [s2If current_user_can(access_s2member_level1)]
- EUR/USD keeps correcting lower and revisits the 1.1170 zone.
The pair currently trades last at 1.11825.
The previous day high was 1.124 while the previous day low was 1.1174. The daily 38.2% Fib levels comes at 1.1199, expected to provide resistance. Similarly, the daily 61.8% fib level is at 1.1215, expected to provide resistance.
EUR/USD leaves behind earlier gains and returns to the area of weekly lows near 1.1170 on Thursday.
While the continuation of the upside momentum appears favoured in the very near term, the ongoing corrective decline carries the potential to drag the pair to the 1.1000 neighbourhood, where a more solid contention is expected to emerge.
Looking at the longer run, the positive view remains unchanged while above the 200-day SMA, today at 1.0680.
Technical Levels: Supports and Resistances
EURUSD currently trading at 1.118 at the time of writing. Pair opened at 1.1201 and is trading with a change of -0.19 % .
| Overview | Overview.1 | |
|---|---|---|
| 0 | Today last price | 1.1180 |
| 1 | Today Daily Change | 58.0000 |
| 2 | Today Daily Change % | -0.1900 |
| 3 | Today daily open | 1.1201 |
The pair remains strongly bullish on the daily timeframe. It trades above its 20 SMA @ 1.1008, 50 SMA 1.0884, 100 SMA @ 1.0872 and 200 SMA @ 1.0675.
| Trends | Trends.1 | |
|---|---|---|
| 0 | Daily SMA20 | 1.1008 |
| 1 | Daily SMA50 | 1.0884 |
| 2 | Daily SMA100 | 1.0872 |
| 3 | Daily SMA200 | 1.0675 |
The previous day high was 1.124 while the previous day low was 1.1174. The daily 38.2% Fib levels comes at 1.1199, expected to provide resistance. Similarly, the daily 61.8% fib level is at 1.1215, expected to provide resistance.
Note the levels of interest below:
- Pivot support is noted at 1.117, 1.1139, 1.1104
- Pivot resistance is noted at 1.1236, 1.1271, 1.1302
| Levels | Levels.1 |
|---|---|
| Previous Daily High | 1.1240 |
| Previous Daily Low | 1.1174 |
| Previous Weekly High | 1.1245 |
| Previous Weekly Low | 1.0944 |
| Previous Monthly High | 1.1012 |
| Previous Monthly Low | 1.0662 |
| Daily Fibonacci 38.2% | 1.1199 |
| Daily Fibonacci 61.8% | 1.1215 |
| Daily Pivot Point S1 | 1.1170 |
| Daily Pivot Point S2 | 1.1139 |
| Daily Pivot Point S3 | 1.1104 |
| Daily Pivot Point R1 | 1.1236 |
| Daily Pivot Point R2 | 1.1271 |
| Daily Pivot Point R3 | 1.1302 |
[/s2If]
Download Nehcap EAWe have two EAs that are operational on our LIVE accounts.
- EA-FIX: Check out the details here. Download EA-FIX . EA-FIX is a non-grid HFT scalper.
- EA-GROWTH: High quality low dd EA using trend grids. Download EA_GROWTHJoin Our Telegram Group
")


