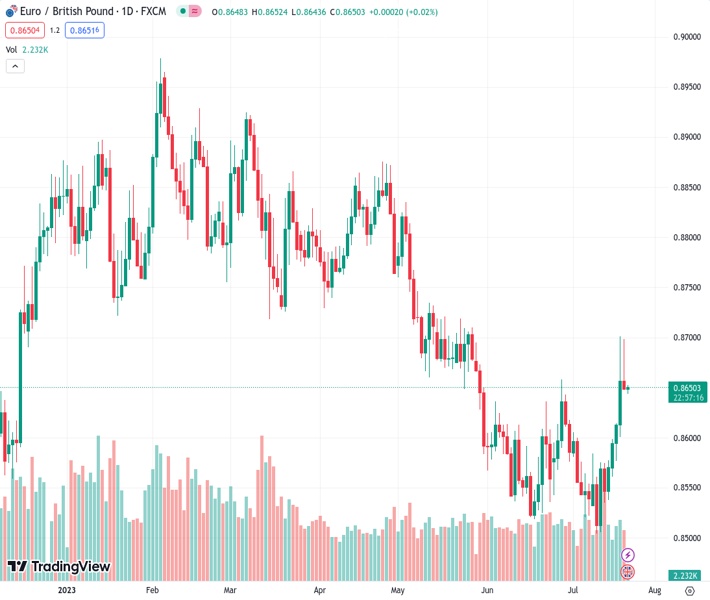
The EURGBP currency pair reached a peak of 0.8700 at the 100-day simple moving average (SMA) before ending the day at 0.8650.
…
This is a premium post.
[s2If !current_user_can(access_s2member_level4)]Please register for FREE REGISTER to read full post below containing analysis. In case of any error or you think you are not able to read the full post below, please email us at support#nehcap.com [lwa][/s2If] [s2If current_user_can(access_s2member_level1)]
- EUR/GBP peaked at a daily high at the 100-day SMA at 0.8700 and then closed at 0.8650.
The pair currently trades last at 0.86504.
The previous day high was 0.8701 while the previous day low was 0.8608. The daily 38.2% Fib levels comes at 0.8665, expected to provide resistance. Similarly, the daily 61.8% fib level is at 0.8643, expected to provide support.
The EUR/GBP reversed its course during the American Session after getting rejected at the 100-day Simple Moving Average at 0.8700 and closed at 0.8650. European data was released with Consumer Confidence dropping in July but lower than expectations, while the German Producer Price Index (PPI) declined 0.3% in June, and the annualised measure dropped to 0.1%.
Regarding the next ECB decision, tightening expectations remain steady. Markets discount a 25 basis point (bps) hike next week, then bet on nearly 60% odds of a similar hike in September and is priced mainly for the December meeting. In the meantime, German yields saw significant increases on Thursday, with the 2, 5 and 10-year rates displaying more than 2% increases.
On the other hand, the GBP continues struggling to find demand following soft inflation figures reported on Wednesday. On Friday, Retail Sales from June in the UK will be reported, and they are expected to have increased by 0.2% and decelerated from their previous figure of 0.3%. They will give a more precise outlook on the British economic situation to model their expectations regarding the Bank of England’s next steps. As for now, the odds of 50 basis points (bps) have fallen to nearly 45% for the next meeting in August, and investors are seeing a terminal rate of 5.75%.
The technical outlook of the daily chart implies that the bulls are in command for the short term, but if they fail to conquer the 100-day SMA after being rejected twice this week, it could trigger a downward leg. Meanwhile, the Relative Strength Index (RSI) stands flat above 50.00, while the Moving Average Convergence Divergence (MACD) prints rising green bars, indicating a buying momentum.
Support levels: 0.8620,0.8600,0.8570.
Resistance levels: 0.8700 (100-day SMA), 0.8730 (200-day SMA), 0.8750.
Technical Levels: Supports and Resistances
EURGBP currently trading at 0.8651 at the time of writing. Pair opened at 0.8657 and is trading with a change of -0.07 % .
| Overview | Overview.1 | |
|---|---|---|
| 0 | Today last price | 0.8651 |
| 1 | Today Daily Change | -0.0006 |
| 2 | Today Daily Change % | -0.0700 |
| 3 | Today daily open | 0.8657 |
The pair is trading above its 20 Daily moving average @ 0.8579, above its 50 Daily moving average @ 0.8609 , below its 100 Daily moving average @ 0.8706 and below its 200 Daily moving average @ 0.873
| Trends | Trends.1 | |
|---|---|---|
| 0 | Daily SMA20 | 0.8579 |
| 1 | Daily SMA50 | 0.8609 |
| 2 | Daily SMA100 | 0.8706 |
| 3 | Daily SMA200 | 0.8730 |
The previous day high was 0.8701 while the previous day low was 0.8608. The daily 38.2% Fib levels comes at 0.8665, expected to provide resistance. Similarly, the daily 61.8% fib level is at 0.8643, expected to provide support.
Note the levels of interest below:
- Pivot support is noted at 0.8609, 0.8562, 0.8516
- Pivot resistance is noted at 0.8703, 0.8749, 0.8797
| Levels | Levels.1 |
|---|---|
| Previous Daily High | 0.8701 |
| Previous Daily Low | 0.8608 |
| Previous Weekly High | 0.8584 |
| Previous Weekly Low | 0.8504 |
| Previous Monthly High | 0.8658 |
| Previous Monthly Low | 0.8518 |
| Daily Fibonacci 38.2% | 0.8665 |
| Daily Fibonacci 61.8% | 0.8643 |
| Daily Pivot Point S1 | 0.8609 |
| Daily Pivot Point S2 | 0.8562 |
| Daily Pivot Point S3 | 0.8516 |
| Daily Pivot Point R1 | 0.8703 |
| Daily Pivot Point R2 | 0.8749 |
| Daily Pivot Point R3 | 0.8797 |
[/s2If]
Download Nehcap EAWe have two EAs that are operational on our LIVE accounts.
- EA-FIX: Check out the details here. Download EA-FIX . EA-FIX is a non-grid HFT scalper.
- EA-GROWTH: High quality low dd EA using trend grids. Download EA_GROWTHJoin Our Telegram Group
")


