EURUSD has reached a stable point at its lowest level for the week, following a significant drop that hasn’t been seen in two months. This decline has been continuing over the past three days.
…
This is a premium post.
[s2If !current_user_can(access_s2member_level4)]Please register for FREE REGISTER to read full post below containing analysis. In case of any error or you think you are not able to read the full post below, please email us at support#nehcap.com [lwa][/s2If] [s2If current_user_can(access_s2member_level1)]
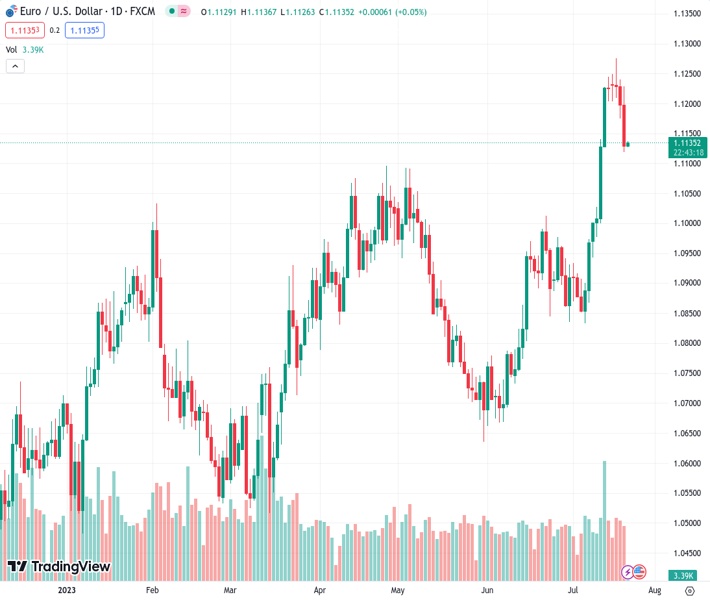
- EUR/USD steadies at weekly bottom after falling the most in two months, printing three-day downtrend.
The pair currently trades last at 1.11350.
The previous day high was 1.124 while the previous day low was 1.1174. The daily 38.2% Fib levels comes at 1.1199, expected to provide resistance. Similarly, the daily 61.8% fib level is at 1.1215, expected to provide resistance.
EUR/USD remains on the back foot as bears take a breather at the lowest level in a week, especially after falling the most in two months the previous day. That said, the Euro pair seesaws around 1.1130 after posting a three-day losing streak on firmer US Dollar, as well as mixed concerns about the US Dollar.
On Thursday, US Initial Jobless Claims dropped to 228K for the week ended on July 14, the lowest since May, versus 237K prior and 242K market forecasts but the Continuing Jobless Claims rose to 1.754M for the said period compared to market forecasts of reprinting 1.729M figures. Additionally, Philadelphia Fed Manufacturing Survey gauge improved to -13.5 for July from -13.7 prior, versus -10 expected while Existing Home Sales slumped -3.3% MoM in June compared to 0.2% prior gain.
Earlier in the week, US Building Permits and Housing Stars also repoted downbeat figures for June whereas the Retail Sales growth eased despite posting upbeat details of Retail Sales Control Group for June.
While looking in totality, the US statistics haven’t been impressive to support the Fed in announcing more rate hikes past July in the next week, which in turn challenge the US Dollar bulls even as the greenback braces for the first weekly gain in three by edging off the 15-month low.
Not only the US data but a recovery in the Treasury bond yields, mainly backed by the downbeat tech sector earnings and a falling US benchmark equity indices, also propel the US Dollar and weigh on the EUR/USD.
At home, Germany’s Producer Price Index (PPI) for June improved to -0.3% MoM versus -0.4% expected and -1.4% prior whereas the preliminary readings of the Eurozone Consumer Confidence for July edged higher to -15.1 from -16.1 prior and -16.0 market forecasts. Furthermore, European Commission (EC) revised the bloc’s first quarter (Q1) Gross Domestic Product (GDP) estimate up 0.1% to 0.0%.
Despite the latest upbeat Eurozone data, the ECB policymakers and a study on the latest trend in the bloc, as shared by Reuters, suggest that the economic fears are gaining momentum, which in turn push back the ECB hawks and flag concerns of the central bank’s policy pivot. The same exerts downside pressure on the Euro.
Looking ahead, a light calendar may allow the Euro pair to consolidate the first weekly loss in three should the market sentiment improves. However, the cautious mood ahead of the next week’s monetary policy decision of the ECB and the Fed may not allow the risk appetite, as well as the EUR/USD, to rise much.
EUR/USD pair’s failure to cross the 1.1280 hurdle, joins the clear downside break of a fortnight-old ascending trend line, now resistance around 1.1310, to direct bears toward the April’s high of around 1.1095.
Technical Levels: Supports and Resistances
EURUSD currently trading at 1.1135 at the time of writing. Pair opened at 1.1201 and is trading with a change of -0.59% % .
| Overview | Overview.1 | |
|---|---|---|
| 0 | Today last price | 1.1135 |
| 1 | Today Daily Change | -0.0066 |
| 2 | Today Daily Change % | -0.59% |
| 3 | Today daily open | 1.1201 |
The pair remains strongly bullish on the daily timeframe. It trades above its 20 SMA @ 1.1008, 50 SMA 1.0884, 100 SMA @ 1.0872 and 200 SMA @ 1.0675.
| Trends | Trends.1 | |
|---|---|---|
| 0 | Daily SMA20 | 1.1008 |
| 1 | Daily SMA50 | 1.0884 |
| 2 | Daily SMA100 | 1.0872 |
| 3 | Daily SMA200 | 1.0675 |
The previous day high was 1.124 while the previous day low was 1.1174. The daily 38.2% Fib levels comes at 1.1199, expected to provide resistance. Similarly, the daily 61.8% fib level is at 1.1215, expected to provide resistance.
Note the levels of interest below:
- Pivot support is noted at 1.117, 1.1139, 1.1104
- Pivot resistance is noted at 1.1236, 1.1271, 1.1302
| Levels | Levels.1 |
|---|---|
| Previous Daily High | 1.1240 |
| Previous Daily Low | 1.1174 |
| Previous Weekly High | 1.1245 |
| Previous Weekly Low | 1.0944 |
| Previous Monthly High | 1.1012 |
| Previous Monthly Low | 1.0662 |
| Daily Fibonacci 38.2% | 1.1199 |
| Daily Fibonacci 61.8% | 1.1215 |
| Daily Pivot Point S1 | 1.1170 |
| Daily Pivot Point S2 | 1.1139 |
| Daily Pivot Point S3 | 1.1104 |
| Daily Pivot Point R1 | 1.1236 |
| Daily Pivot Point R2 | 1.1271 |
| Daily Pivot Point R3 | 1.1302 |
[/s2If]
Download Nehcap EAWe have two EAs that are operational on our LIVE accounts.
- EA-FIX: Check out the details here. Download EA-FIX . EA-FIX is a non-grid HFT scalper.
- EA-GROWTH: High quality low dd EA using trend grids. Download EA_GROWTHJoin Our Telegram Group
")


