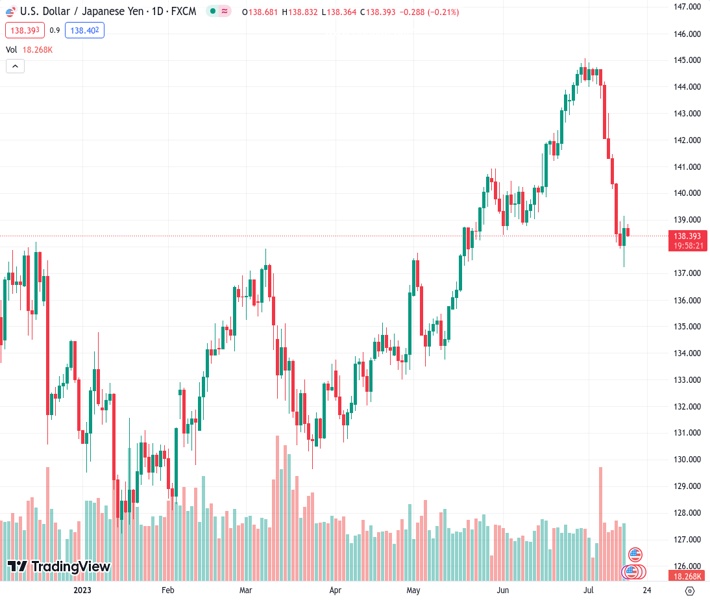
The USDJPY pair, currently at a rate of 138.384, is unable to gain strength and recover from a decline to a two-month low, despite several contributing factors.
…
This is a premium post.
[s2If !current_user_can(access_s2member_level4)]Please register for FREE REGISTER to read full post below containing analysis. In case of any error or you think you are not able to read the full post below, please email us at support#nehcap.com [lwa][/s2If] [s2If current_user_can(access_s2member_level1)]
- A combination of factors fails to assist USD/JPY to build on Friday’s bounce from a two-month low.
The pair currently trades last at 138.384.
The previous day high was 139.16 while the previous day low was 137.24. The daily 38.2% Fib levels comes at 138.43, expected to provide resistance. Similarly, the daily 61.8% fib level is at 137.97, expected to provide support.
The USD/JPY pair struggles to capitalize on Friday’s goodish rebound from the 137.25 area, or a nearly two-month low and kicks off the new week on a subdued note. Spot prices oscillate in a narrow trading band through the Asian session and currently trade just above mid-138.00s, awaiting a fresh catalyst before the next leg of a directional move.
In the meantime, speculations that the Bank of Japan (BoJ) could adjust its Yield Curve Control (YCC) policy as soon as this month might continue to underpin the Japanese Yen (JPY) and act as a headwind for the USD/JPY pair. The bets were lifted by recent data, which showed that Japan’s nominal base salary grew at the fastest pace in 28 years in May. Furthermore, Japanese media reported that the BoJ is likely to raise its FY2023 inflation forecast, which has exceeded the 2% goal for more than a year and should put pressure on the central bank to start unwinding its ultra-loose monetary policy settings. This has pushed the yield on the benchmark 10-year Japanese government bond to its highest level since late April last week and lent support to the JPY.
Apart from this, a mildly softer tone around the US equity futures further benefits the safe-haven JPY and contributes to capping the upside for the USD/JPY pair. This, along with the underlying bearish sentiment surrounding the US Dollar (USD), suggests that the path of least resistance for spot prices is to the downside. Investors now seem convinced that the Federal Reserve (Fed) is nearing the end of its rate-hiking cycle, especially after the latest US CPI report showed a further moderation in consumer prices. Adding to this, the US PPI recorded the smallest annual rise in nearly three years in June, which, along with signs that the US labour market is cooling, should allow the US central bank to hold interest rates after the widely anticipated 25 bps lift-off in July.
This fails to assist the USD to build on its modest bounce from the lowest level since April 2022 touched on Friday and favours the USD/JPY bears. Furthermore, technical indicators on the daily chart are holding deep in the negative territory and are still far from being in the oversold zone, validating the near-term bearish outlook for the major. Hence, any intraday positive move might still be seen as a selling opportunity and runs the risk of fizzling out rather quickly. Market participants now look to the Chinese macro data dump, which might influence the broader risk sentiment and provide some impetus to the pair. Later during the early North American session, traders will take cues from the release of the Empire State Manufacturing Index from the US.
Technical Levels: Supports and Resistances
USDJPY currently trading at 138.55 at the time of writing. Pair opened at 138.81 and is trading with a change of -0.19 % .
| Overview | Overview.1 | |
|---|---|---|
| 0 | Today last price | 138.55 |
| 1 | Today Daily Change | -0.26 |
| 2 | Today Daily Change % | -0.19 |
| 3 | Today daily open | 138.81 |
The pair is trading below its 20 Daily moving average @ 142.52, below its 50 Daily moving average @ 140.15 , above its 100 Daily moving average @ 137.02 and above its 200 Daily moving average @ 137.09
| Trends | Trends.1 | |
|---|---|---|
| 0 | Daily SMA20 | 142.52 |
| 1 | Daily SMA50 | 140.15 |
| 2 | Daily SMA100 | 137.02 |
| 3 | Daily SMA200 | 137.09 |
The previous day high was 139.16 while the previous day low was 137.24. The daily 38.2% Fib levels comes at 138.43, expected to provide resistance. Similarly, the daily 61.8% fib level is at 137.97, expected to provide support.
Note the levels of interest below:
- Pivot support is noted at 137.65, 136.49, 135.73
- Pivot resistance is noted at 139.57, 140.32, 141.49
| Levels | Levels.1 |
|---|---|
| Previous Daily High | 139.16 |
| Previous Daily Low | 137.24 |
| Previous Weekly High | 143.00 |
| Previous Weekly Low | 137.24 |
| Previous Monthly High | 145.07 |
| Previous Monthly Low | 138.43 |
| Daily Fibonacci 38.2% | 138.43 |
| Daily Fibonacci 61.8% | 137.97 |
| Daily Pivot Point S1 | 137.65 |
| Daily Pivot Point S2 | 136.49 |
| Daily Pivot Point S3 | 135.73 |
| Daily Pivot Point R1 | 139.57 |
| Daily Pivot Point R2 | 140.32 |
| Daily Pivot Point R3 | 141.49 |
[/s2If]
Download Nehcap EAWe have two EAs that are operational on our LIVE accounts.
- EA-FIX: Check out the details here. Download EA-FIX . EA-FIX is a non-grid HFT scalper.
- EA-GROWTH: High quality low dd EA using trend grids. Download EA_GROWTHJoin Our Telegram Group
")


