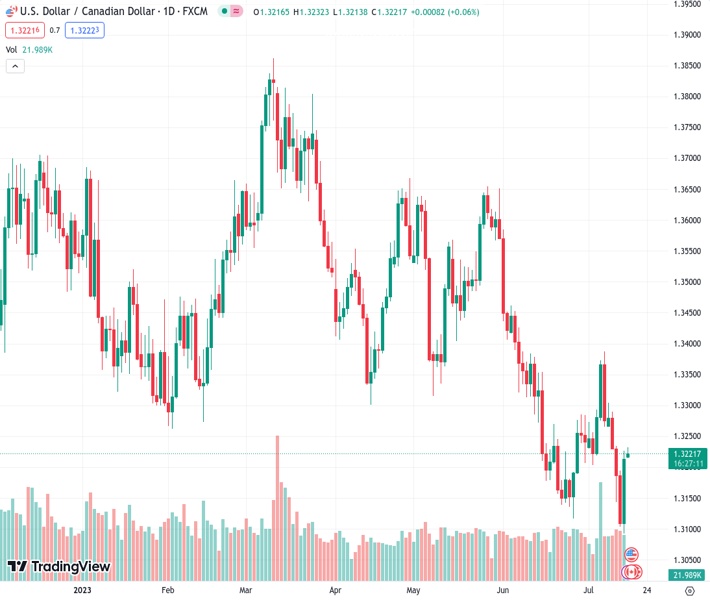
The USDCAD pair at a rate of 1.32215 shows signs of gaining more momentum and continuing to recover from its lowest point this year.
…
This is a premium post.
[s2If !current_user_can(access_s2member_level4)]Please register for FREE REGISTER to read full post below containing analysis. In case of any error or you think you are not able to read the full post below, please email us at support#nehcap.com [lwa][/s2If] [s2If current_user_can(access_s2member_level1)]
- USD/CAD gains some follow-through traction and recovers further from the YTD low.
The pair currently trades last at 1.32215.
The previous day high was 1.3227 while the previous day low was 1.3093. The daily 38.2% Fib levels comes at 1.3176, expected to provide support. Similarly, the daily 61.8% fib level is at 1.3144, expected to provide support.
The USD/CAD pair kicks off the new week on a positive note and builds on Friday’s goodish recovery move from sub-1.3100 levels, or the lowest since September 2022. Spot prices stick to modest intraday gains through the Asian session and currently trade near the 1.3225 region, albeit lack any follow-through buying.
Crude Oil prices drift lower for the second straight day as worries that a global economic downturn will dent fuel demand prompt bulls to take some profits off the table, especially after the recent runup to the highest level since April. The concerns resurfaced following the release of rather unimpressive macro data from China, which showed that growth in the world’s second-largest economy slowed in the second quarter. Adding to this, the resumption of Oil production in Libya over the weekend weighs on the black liquid. This, in turn, is seen undermining the commodity-linked Loonie and acting as a tailwind for the USD/CAD pair.
The US Dollar (USD), on the other hand, continues to draw support from the upbeat US data released on Friday, which showed that consumer confidence in July surged to the highest since September 2021. Moreover, a softer tone around the US equity futures further benefits the Greenback’s relative safe-haven status. That said, growing acceptance that the Federal Reserve (Fed) will keep interest rates steady for the rest of the year, following the widely anticipated 25 bps in July, holds back the USD bulls from placing aggressive bets. This, in turn, might keep a lid on any meaningful upside for the USD/CAD pair, at least for the time being.
Market participants now look forward to the Empire State Manufacturing Index, due for release from the US later during the early North American session. Apart from this, the broader risk sentiment will drive the USD demand and provide some impetus to the major. Traders will further take cues from Oil price dynamics to grab short-term opportunities around the USD/CAD pair. The focus, however, will remain glued to the latest Canadian consumer inflation figures on Tuesday, which should play a key role in determining the Bank of Canada’s next policy move and the next leg of a directional move for the major.
Technical Levels: Supports and Resistances
USDCAD currently trading at 1.3223 at the time of writing. Pair opened at 1.3217 and is trading with a change of 0.05 % .
| Overview | Overview.1 | |
|---|---|---|
| 0 | Today last price | 1.3223 |
| 1 | Today Daily Change | 0.0006 |
| 2 | Today Daily Change % | 0.0500 |
| 3 | Today daily open | 1.3217 |
The pair remains strongly bearish on the daily time frame. It trades below the 20 SMA @ 1.3223, 50 SMA 1.3358, 100 SMA @ 1.3472 and 200 SMA @ 1.3492.
| Trends | Trends.1 | |
|---|---|---|
| 0 | Daily SMA20 | 1.3223 |
| 1 | Daily SMA50 | 1.3358 |
| 2 | Daily SMA100 | 1.3472 |
| 3 | Daily SMA200 | 1.3492 |
The previous day high was 1.3227 while the previous day low was 1.3093. The daily 38.2% Fib levels comes at 1.3176, expected to provide support. Similarly, the daily 61.8% fib level is at 1.3144, expected to provide support.
Note the levels of interest below:
- Pivot support is noted at 1.3131, 1.3045, 1.2997
- Pivot resistance is noted at 1.3265, 1.3313, 1.3399
| Levels | Levels.1 |
|---|---|
| Previous Daily High | 1.3227 |
| Previous Daily Low | 1.3093 |
| Previous Weekly High | 1.3304 |
| Previous Weekly Low | 1.3093 |
| Previous Monthly High | 1.3585 |
| Previous Monthly Low | 1.3117 |
| Daily Fibonacci 38.2% | 1.3176 |
| Daily Fibonacci 61.8% | 1.3144 |
| Daily Pivot Point S1 | 1.3131 |
| Daily Pivot Point S2 | 1.3045 |
| Daily Pivot Point S3 | 1.2997 |
| Daily Pivot Point R1 | 1.3265 |
| Daily Pivot Point R2 | 1.3313 |
| Daily Pivot Point R3 | 1.3399 |
[/s2If]
Download Nehcap EAWe have two EAs that are operational on our LIVE accounts.
- EA-FIX: Check out the details here. Download EA-FIX . EA-FIX is a non-grid HFT scalper.
- EA-GROWTH: High quality low dd EA using trend grids. Download EA_GROWTHJoin Our Telegram Group
")


