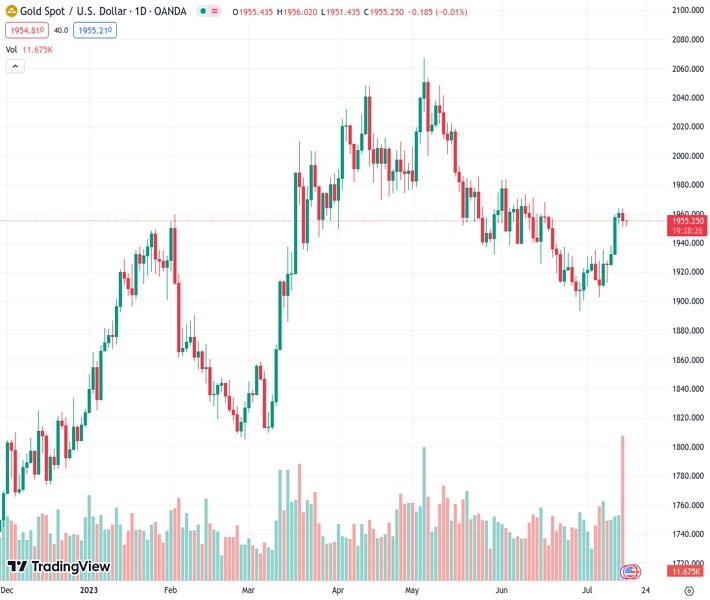
The price of gold, at 1,954.75 for #XAUUSD, is facing difficulties in making significant progress on the initial day of the week.
…
This is a premium post.
[s2If !current_user_can(access_s2member_level4)]Please register for FREE REGISTER to read full post below containing analysis. In case of any error or you think you are not able to read the full post below, please email us at support#nehcap.com [lwa][/s2If] [s2If current_user_can(access_s2member_level1)]
- Gold price struggles to gain any meaningful traction on the first day of a new week.
The pair currently trades last at 1954.75.
The previous day high was 1963.82 while the previous day low was 1950.95. The daily 38.2% Fib levels comes at 1955.87, expected to provide resistance. Similarly, the daily 61.8% fib level is at 1958.9, expected to provide resistance.
Gold price kicks off the new week on a subdued note and oscillates in a narrow trading band, just above the $1,950 level through the Asian session. The range-bound price action might still be categorized as a bullish consolidation phase and warrants some caution before positioning for any meaningful corrective decline from a one-month peak touched on Friday.
The fact that consumer confidence in the United States (US) soared to the highest level since September 2021 assists the US Dollar (USD) to hold steady above its lowest level since April 2022, which, in turn, is seen acting as a headwind for the Gold price. In fact, the preliminary University of Michigan (UoM) Consumer Confidence Index surpassed even the most optimistic estimates and came in at 72.6 for July – the highest since September 2021. Additional details of the report showed that expectations for inflation over the next year edged higher to 3.4% from 3.3% in June. This, however, was still down from the high of 5.4% in April 2022.
This comes on the back of the latest US CPI report, which pointed to a further moderation in consumer prices. Furthermore, the US PPI recorded the smallest annual rise in nearly three years in June. This, along with signs that the US labor market is cooling, lifts bets that the Federal Reserve (Fed) is nearing the end of its policy tightening cycle. Investors now seem convinced that the Fed will hold interest rates steady after the expected 25 basis points (bps) lift-off in July. This, in turn, fails to assist the USD to capitalize on Friday’s modest recovery from its lowest level since April 2022 and should lend some support to the non-yielding Gold price.
Apart from this, a modest downtick in the US equity futures could act as a tailwind for the safe-haven precious metal and help limit the downside, at least for the time being. Market participants now look to the Chinese macro data dump, which might influence the risk sentiment and provide some impetus to the Gold price. The aforementioned fundamental backdrop, meanwhile, suggests that the path of least resistance for the XAU/USD is to the upside. Hence, any downfall might still be seen as a buying opportunity and is more likely to remain cushioned, at least for the time being.
Technical Levels: Supports and Resistances
XAUUSD currently trading at 1953.94 at the time of writing. Pair opened at 1955.23 and is trading with a change of -0.07 % .
| Overview | Overview.1 | |
|---|---|---|
| 0 | Today last price | 1953.94 |
| 1 | Today Daily Change | -1.29 |
| 2 | Today Daily Change % | -0.07 |
| 3 | Today daily open | 1955.23 |
The pair is trading above its 20 Daily moving average @ 1927.74, below its 50 Daily moving average @ 1954.5 , above its 100 Daily moving average @ 1953.64 and above its 200 Daily moving average @ 1872.41
| Trends | Trends.1 | |
|---|---|---|
| 0 | Daily SMA20 | 1927.74 |
| 1 | Daily SMA50 | 1954.50 |
| 2 | Daily SMA100 | 1953.64 |
| 3 | Daily SMA200 | 1872.41 |
The previous day high was 1963.82 while the previous day low was 1950.95. The daily 38.2% Fib levels comes at 1955.87, expected to provide resistance. Similarly, the daily 61.8% fib level is at 1958.9, expected to provide resistance.
Note the levels of interest below:
- Pivot support is noted at 1949.51, 1943.8, 1936.64
- Pivot resistance is noted at 1962.38, 1969.54, 1975.25
| Levels | Levels.1 |
|---|---|
| Previous Daily High | 1963.82 |
| Previous Daily Low | 1950.95 |
| Previous Weekly High | 1963.82 |
| Previous Weekly Low | 1912.74 |
| Previous Monthly High | 1983.50 |
| Previous Monthly Low | 1893.01 |
| Daily Fibonacci 38.2% | 1955.87 |
| Daily Fibonacci 61.8% | 1958.90 |
| Daily Pivot Point S1 | 1949.51 |
| Daily Pivot Point S2 | 1943.80 |
| Daily Pivot Point S3 | 1936.64 |
| Daily Pivot Point R1 | 1962.38 |
| Daily Pivot Point R2 | 1969.54 |
| Daily Pivot Point R3 | 1975.25 |
[/s2If]
Download Nehcap EAWe have two EAs that are operational on our LIVE accounts.
- EA-FIX: Check out the details here. Download EA-FIX . EA-FIX is a non-grid HFT scalper.
- EA-GROWTH: High quality low dd EA using trend grids. Download EA_GROWTHJoin Our Telegram Group
")


