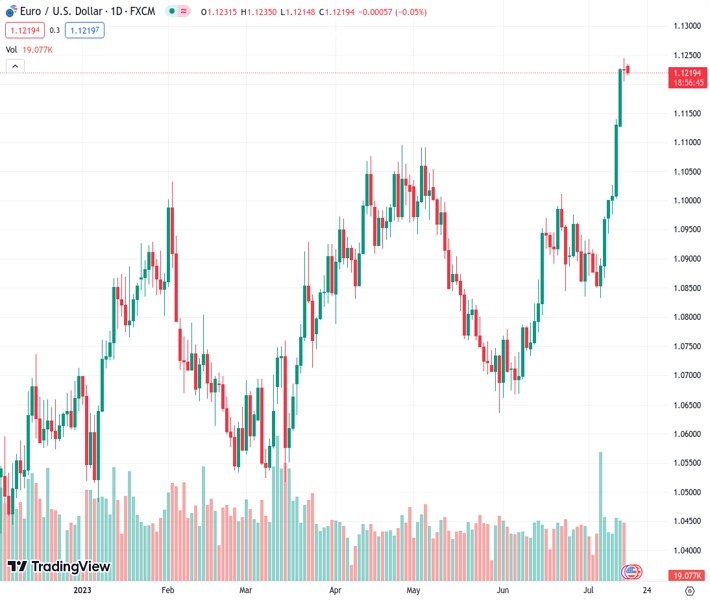
The EURUSD pair, currently at 1.12152, is experiencing selling pressure which has caused it to reach a new low for the day. This decline is an extension of the previous retracement from a 17-month high. The viewpoint from the user “nehcap” suggests that they expect the downside to be limited.
…
This is a premium post.
[s2If !current_user_can(access_s2member_level4)]Please register for FREE REGISTER to read full post below containing analysis. In case of any error or you think you are not able to read the full post below, please email us at support#nehcap.com [lwa][/s2If] [s2If current_user_can(access_s2member_level1)]
- EUR/USD takes offers to refresh intraday low, extends pullback from 17-month high.
The pair currently trades last at 1.12152.
The previous day high was 1.1245 while the previous day low was 1.1204. The daily 38.2% Fib levels comes at 1.1229, expected to provide resistance. Similarly, the daily 61.8% fib level is at 1.122, expected to provide resistance.
EUR/USD renews its intraday low near 1.1220 while extending the previous day’s pullback from the highest levels since February 2022 during a mid-Asian session on Monday. In doing so, the Euro pair justifies the bearish Doji candlestick, as well as the overbought RSI (14) line, while teasing the sellers.
It’s worth noting that the Doji candlestick gains more attention, as well as appears effective in activating the price reversal, if it is spotted at the multi-month high. Also amplifying the odds of witnessing the pullback in the EUR/USD could be the RSI (14) conditions and a shift in the market sentiment, not to forget the reassessment of the Fed bias.
Also read: EUR/USD eases from multi-month high past 1.1200 as traders reconfirm Fed bias
With this in mind, EUR/USD sellers are likely rushing towards a five-month-old previous resistance line, now support around 1.1160. However, the 1.1200 round figure and a one-week-old rising trend line near 1.1120 are extra filters to watch before welcoming the Euro bears.
It should be noted that April’s high of 1.1095 acts as the final defense of the EUR/USD bulls, a break of which can drag prices toward June’s peak surrounding 1.1010 before highlighting the 100-DMA support of 1.0860.
On the flip side, a daily closing beyond the previous day’s peak of 1.1245 will defy the bearish bias favored by the latest candlestick formation. However, multiple levels marked during early 2022 around 1.1280 will join the overbought RSI line to challenge the EUR/USD bulls afterward.
In a case where the EUR/USD pair remains firmer past 1.1280, the odds of witnessing a run-up towards the February 2022 peak of around 1.1500 can’t be ruled out.
Trend: Limited downside expected
Technical Levels: Supports and Resistances
EURUSD currently trading at 1.122 at the time of writing. Pair opened at 1.1227 and is trading with a change of -0.06% % .
| Overview | Overview.1 | |
|---|---|---|
| 0 | Today last price | 1.122 |
| 1 | Today Daily Change | -0.0007 |
| 2 | Today Daily Change % | -0.06% |
| 3 | Today daily open | 1.1227 |
The pair remains strongly bullish on the daily timeframe. It trades above its 20 SMA @ 1.0966, 50 SMA 1.087, 100 SMA @ 1.0854 and 200 SMA @ 1.0653.
| Trends | Trends.1 | |
|---|---|---|
| 0 | Daily SMA20 | 1.0966 |
| 1 | Daily SMA50 | 1.0870 |
| 2 | Daily SMA100 | 1.0854 |
| 3 | Daily SMA200 | 1.0653 |
The previous day high was 1.1245 while the previous day low was 1.1204. The daily 38.2% Fib levels comes at 1.1229, expected to provide resistance. Similarly, the daily 61.8% fib level is at 1.122, expected to provide resistance.
Note the levels of interest below:
- Pivot support is noted at 1.1206, 1.1185, 1.1165
- Pivot resistance is noted at 1.1247, 1.1266, 1.1287
| Levels | Levels.1 |
|---|---|
| Previous Daily High | 1.1245 |
| Previous Daily Low | 1.1204 |
| Previous Weekly High | 1.1245 |
| Previous Weekly Low | 1.0944 |
| Previous Monthly High | 1.1012 |
| Previous Monthly Low | 1.0662 |
| Daily Fibonacci 38.2% | 1.1229 |
| Daily Fibonacci 61.8% | 1.1220 |
| Daily Pivot Point S1 | 1.1206 |
| Daily Pivot Point S2 | 1.1185 |
| Daily Pivot Point S3 | 1.1165 |
| Daily Pivot Point R1 | 1.1247 |
| Daily Pivot Point R2 | 1.1266 |
| Daily Pivot Point R3 | 1.1287 |
[/s2If]
Download Nehcap EAWe have two EAs that are operational on our LIVE accounts.
- EA-FIX: Check out the details here. Download EA-FIX . EA-FIX is a non-grid HFT scalper.
- EA-GROWTH: High quality low dd EA using trend grids. Download EA_GROWTHJoin Our Telegram Group
")


