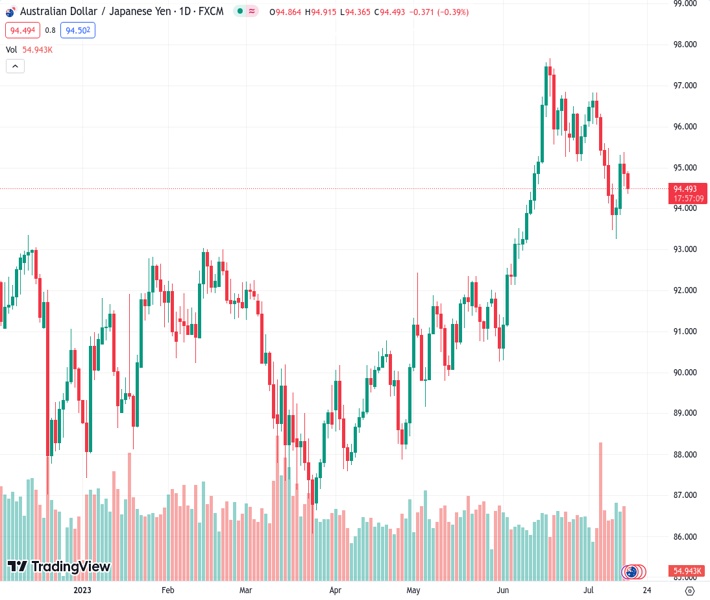
The AUDJPY pair, currently trading at 94.5020, remains steady above the 94.50 level after pulling back from its highest point of the week.
…
This is a premium post.
[s2If !current_user_can(access_s2member_level4)]Please register for FREE REGISTER to read full post below containing analysis. In case of any error or you think you are not able to read the full post below, please email us at support#nehcap.com [lwa][/s2If] [s2If current_user_can(access_s2member_level1)]
- AUD/JPY manages to stabilize above the 94.50 area after retreating from a weekly high.
The pair currently trades last at 94.5020.
The previous day high was 95.38 while the previous day low was 94.55. The daily 38.2% Fib levels comes at 94.87, expected to provide resistance. Similarly, the daily 61.8% fib level is at 95.06, expected to provide resistance.
The AUD/JPY pair drops from a weekly high of 95.40 and remains steady around 94.50 during the early Asian session on Monday. According to the one-hour chart, the path of least resistance for the AUD/JPY is to the downside, as the cross stands below the 50- and 100-hour Exponential Moving Averages (EMA).
The 94.70 level is the immediate barrier for AUD/JPY bulls, representing the 100-hour EMA. A break above the latter could see the cross test 95.40 (High of July 14), followed by 95.60 (High of July 7). The critical resistance level is seen at 96.00, portraying a psychological round mark and a low of July 5.
On the flip side, the cross will meet an initial support level at 94.35 (a daily low). The next contention is seen at 94.00, representing a psychological level and horizontal support line. The additional downside filter to watch is 93.65 (Low of July 12).
It’s worth noting that the Relative Strength Index (RSI) is in a downtrend approaching the oversold zone. Further downside for AUD/JPY cannot be ruled out.
Technical Levels: Supports and Resistances
AUDJPY currently trading at 94.53 at the time of writing. Pair opened at 94.93 and is trading with a change of -0.42 % .
| Overview | Overview.1 | |
|---|---|---|
| 0 | Today last price | 94.53 |
| 1 | Today Daily Change | -0.40 |
| 2 | Today Daily Change % | -0.42 |
| 3 | Today daily open | 94.93 |
The pair is trading below its 20 Daily moving average @ 95.7, above its 50 Daily moving average @ 93.71 , above its 100 Daily moving average @ 91.59 and above its 200 Daily moving average @ 91.85
| Trends | Trends.1 | |
|---|---|---|
| 0 | Daily SMA20 | 95.70 |
| 1 | Daily SMA50 | 93.71 |
| 2 | Daily SMA100 | 91.59 |
| 3 | Daily SMA200 | 91.85 |
The previous day high was 95.38 while the previous day low was 94.55. The daily 38.2% Fib levels comes at 94.87, expected to provide resistance. Similarly, the daily 61.8% fib level is at 95.06, expected to provide resistance.
Note the levels of interest below:
- Pivot support is noted at 94.52, 94.12, 93.68
- Pivot resistance is noted at 95.36, 95.79, 96.2
| Levels | Levels.1 |
|---|---|
| Previous Daily High | 95.38 |
| Previous Daily Low | 94.55 |
| Previous Weekly High | 95.48 |
| Previous Weekly Low | 93.27 |
| Previous Monthly High | 97.68 |
| Previous Monthly Low | 90.30 |
| Daily Fibonacci 38.2% | 94.87 |
| Daily Fibonacci 61.8% | 95.06 |
| Daily Pivot Point S1 | 94.52 |
| Daily Pivot Point S2 | 94.12 |
| Daily Pivot Point S3 | 93.68 |
| Daily Pivot Point R1 | 95.36 |
| Daily Pivot Point R2 | 95.79 |
| Daily Pivot Point R3 | 96.20 |
[/s2If]
Download Nehcap EAWe have two EAs that are operational on our LIVE accounts.
- EA-FIX: Check out the details here. Download EA-FIX . EA-FIX is a non-grid HFT scalper.
- EA-GROWTH: High quality low dd EA using trend grids. Download EA_GROWTHJoin Our Telegram Group
")


