In the Asian session, the price of gold (XAUUSD) declines and remains higher than $1,950.
…
This is a premium post.
[s2If !current_user_can(access_s2member_level4)]Please register for FREE REGISTER to read full post below containing analysis. In case of any error or you think you are not able to read the full post below, please email us at support#nehcap.com [lwa][/s2If] [s2If current_user_can(access_s2member_level1)]
- Gold loses momentum and holds above $1,950 in the Asian session.
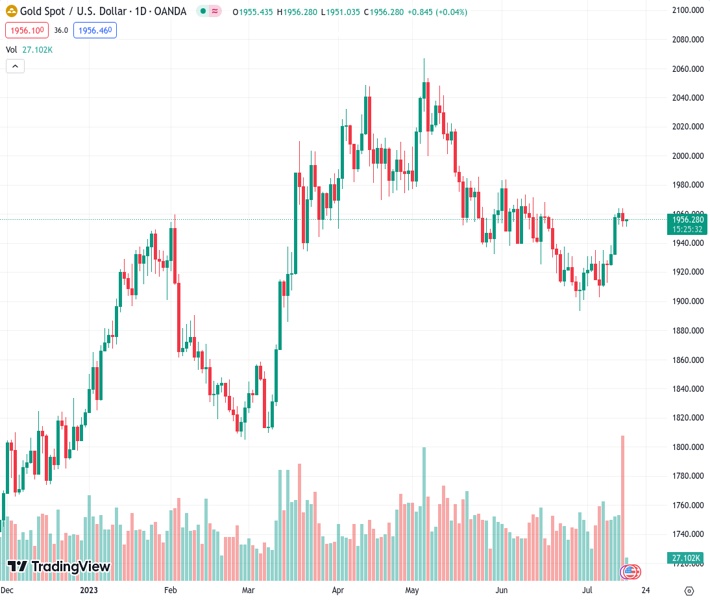
The pair currently trades last at 1955.31.
The previous day high was 1963.82 while the previous day low was 1950.95. The daily 38.2% Fib levels comes at 1955.87, expected to provide resistance. Similarly, the daily 61.8% fib level is at 1958.9, expected to provide resistance.
Gold price struggles to gain traction and extends Friday’s retracement slide from the $1,965 area. The precious metal currently trades around $1,950 in the Asian session following the mixed Chinese data.
That said, the upbeat US consumer confidence helped the US Dollar recover above its lowest level since April 2022, dragging gold prices lower on Friday.
The preliminary reading of the University of Michigan’s (UoM) Consumer Confidence Index rose to 72.6 from 64.4 in June, beating the market’s expectation of 65.5. Additionally, US consumer prices climbed by 3.0% year on year, down from 4.0% previously, and the Producer Price Index (PPI) increased by 0.1%, down from 0.9% prior. Market participants anticipate the Federal Reserve (Fed) to be less hawkish in tightening monetary policy following an expected interest rate hike in the July 26 meeting. This, in turn, could be the headwind for the US Dollar and might cap the downside for gold.
On the Chinese front, the latest National Bureau of Statistics (NBS) data reported that the Chinese Gross Domestic Product (GDP) came in at 6.3% annually, lower than predicted at 7.3% and 4.5% previously. At the same time, Industrial Production YoY increased by 4.4% from 3.5% the previous year, above the consensus of 2.7%.
Additionally, Retail Sales fell to 3.1% YoY from June, down from 12.7% previously and 3.2% expected by the market. The mixed economic figure helps gold to limit the loss. However, investors remain focused on the Chinese data. It’s worth noting that the fear of an economic slowdown in China could have a negative impact on the gold price as China is the biggest gold consumer.
The Fed enters its blackout period ahead of the July 25-26 meeting. Market participants will take cues from the US data. The Empire State Manufacturing Index and Retail Sales MoM from June will be due later this week. These data will play a key role in influencing the near-term US Dollar price dynamic and help determine the next direction for gold prices.
Technical Levels: Supports and Resistances
XAUUSD currently trading at 1954.76 at the time of writing. Pair opened at 1955.23 and is trading with a change of -0.02 % .
| Overview | Overview.1 | |
|---|---|---|
| 0 | Today last price | 1954.76 |
| 1 | Today Daily Change | -0.47 |
| 2 | Today Daily Change % | -0.02 |
| 3 | Today daily open | 1955.23 |
The pair remains strongly bullish on the daily timeframe. It trades above its 20 SMA @ 1927.74, 50 SMA 1954.5, 100 SMA @ 1953.64 and 200 SMA @ 1872.41.
| Trends | Trends.1 | |
|---|---|---|
| 0 | Daily SMA20 | 1927.74 |
| 1 | Daily SMA50 | 1954.50 |
| 2 | Daily SMA100 | 1953.64 |
| 3 | Daily SMA200 | 1872.41 |
The previous day high was 1963.82 while the previous day low was 1950.95. The daily 38.2% Fib levels comes at 1955.87, expected to provide resistance. Similarly, the daily 61.8% fib level is at 1958.9, expected to provide resistance.
Note the levels of interest below:
- Pivot support is noted at 1949.51, 1943.8, 1936.64
- Pivot resistance is noted at 1962.38, 1969.54, 1975.25
| Levels | Levels.1 |
|---|---|
| Previous Daily High | 1963.82 |
| Previous Daily Low | 1950.95 |
| Previous Weekly High | 1963.82 |
| Previous Weekly Low | 1912.74 |
| Previous Monthly High | 1983.50 |
| Previous Monthly Low | 1893.01 |
| Daily Fibonacci 38.2% | 1955.87 |
| Daily Fibonacci 61.8% | 1958.90 |
| Daily Pivot Point S1 | 1949.51 |
| Daily Pivot Point S2 | 1943.80 |
| Daily Pivot Point S3 | 1936.64 |
| Daily Pivot Point R1 | 1962.38 |
| Daily Pivot Point R2 | 1969.54 |
| Daily Pivot Point R3 | 1975.25 |
[/s2If]
Download Nehcap EAWe have two EAs that are operational on our LIVE accounts.
- EA-FIX: Check out the details here. Download EA-FIX . EA-FIX is a non-grid HFT scalper.
- EA-GROWTH: High quality low dd EA using trend grids. Download EA_GROWTHJoin Our Telegram Group
")


