The AUDUSD starts the trading week in a defensive stance following its largest weekly increase since November.
…
This is a premium post.
[s2If !current_user_can(access_s2member_level4)]Please register for FREE REGISTER to read full post below containing analysis. In case of any error or you think you are not able to read the full post below, please email us at support#nehcap.com [lwa][/s2If] [s2If current_user_can(access_s2member_level1)]
- AUD/USD begins trading week on a defensive note after posting the biggest weekly gain since November.
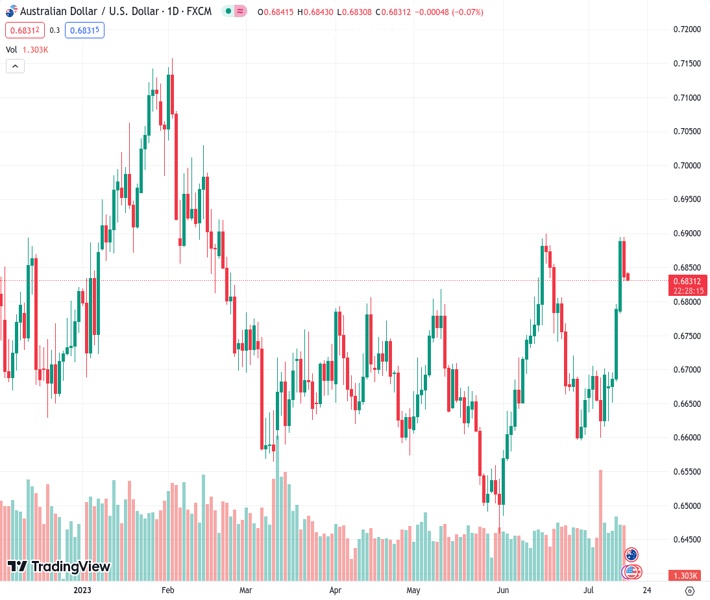
The pair currently trades last at 0.68363.
The previous day high was 0.6895 while the previous day low was 0.6831. The daily 38.2% Fib levels comes at 0.6855, expected to provide resistance. Similarly, the daily 61.8% fib level is at 0.687, expected to provide resistance.
AUD/USD offers a dull start to the week’s trading, after a few days of volatility, as it makes rounds to 0.6840 amid early Monday morning in Asia. In doing so, the Aussie pair stays defensive after reversing from a one-month high, as well as posting the biggest weekly gain since November 2022.
That said, the Aussie pair’s latest weakness could be linked to downbeat comments from Australia Treasurer Jim Chalmers, as well as the upbeat US Consumer Sentiment Index data published the last Friday. Furthermore, a cautious mood ahead of the key China data also allowed the AUD/USD bulls to take a breather after rising heavily in the last week.
Australia Treasurer Chalmers appeared for an interview with the local media during the weekend where he backed the Reserve Bank of Australia’s (RBA) downbeat economic forecasts. In doing so, the policymaker conveyed his expectations of witnessing a sharp economic slowdown, easing inflation and a pick-up in the unemployment rate. “As the Reserve Bank forecasts and the Treasury forecasts have inflation moderating over the coming months, they do have a tick up in unemployment as well,” Chalmers told the Australian Broadcasting Corp per Reuters.
On the other hand, the preliminary reading of the University of Michigan’s (UoM) Consumer Confidence Index rose to 72.6 from 64.4 in June, versus the market’s expectations of 65.5. Further details suggested that the one-year and 5-year consumer inflation expectations per the UoM survey edged higher to 3.4% and 3.1% in that order versus 3.3% and 3% respective priors. Earlier in the week, the US Consumer Price Index (CPI) and Producer Price Index (PPI) for June dropped to 3.0% and 0.1% on a yearly basis from 4.0% and 0.9% YoY in that order, which in turn drowned the US Dollar amid fears of nearness to the Fed’s policy pivot.
It should be noted that the selection of Michele Bullock as the next RBA Governor and her initial comments also weighed on the AUD/USD price as she flagged concerns about witnessing an economic slowdown. Furthermore, fears about China’s slowdown in economic recovery and the US-China tension also challenge the Aussie pair.
Amid these plays, equities has a good week and yields drowned, which in turn weighed on the US Dollar Index and propelled the AUD/USD price despite the latest retreat.
Moving on, China’s second quarter (Q2) 2023 Gross Domestic Product (GDP) will join the Industrial Production and Retail Sales for June to direct immediate AUD/USD moves. However, major attention will be given to this week’s RBA Minutes and Aussie job number, as well as the US Retail Sales for June for clear directions.
Double tops around 0.6900 and nearly overbought RSI conditions suggest a pullback toward the 0.6780 horizontal support. However, a convergence of the 50-SMA and 100-SMA, near 0.6685 at the latest, appears a tough nut to crack for the bears before retaking control.
Technical Levels: Supports and Resistances
AUDUSD currently trading at 0.6834 at the time of writing. Pair opened at 0.6839 and is trading with a change of -0.07% % .
| Overview | Overview.1 | |
|---|---|---|
| 0 | Today last price | 0.6834 |
| 1 | Today Daily Change | -0.0005 |
| 2 | Today Daily Change % | -0.07% |
| 3 | Today daily open | 0.6839 |
The pair remains strongly bullish on the daily timeframe. It trades above its 20 SMA @ 0.6716, 50 SMA 0.6686, 100 SMA @ 0.6685 and 200 SMA @ 0.6705.
| Trends | Trends.1 | |
|---|---|---|
| 0 | Daily SMA20 | 0.6716 |
| 1 | Daily SMA50 | 0.6686 |
| 2 | Daily SMA100 | 0.6685 |
| 3 | Daily SMA200 | 0.6705 |
The previous day high was 0.6895 while the previous day low was 0.6831. The daily 38.2% Fib levels comes at 0.6855, expected to provide resistance. Similarly, the daily 61.8% fib level is at 0.687, expected to provide resistance.
Note the levels of interest below:
- Pivot support is noted at 0.6815, 0.679, 0.675
- Pivot resistance is noted at 0.6879, 0.6919, 0.6943
| Levels | Levels.1 |
|---|---|
| Previous Daily High | 0.6895 |
| Previous Daily Low | 0.6831 |
| Previous Weekly High | 0.6895 |
| Previous Weekly Low | 0.6624 |
| Previous Monthly High | 0.6900 |
| Previous Monthly Low | 0.6484 |
| Daily Fibonacci 38.2% | 0.6855 |
| Daily Fibonacci 61.8% | 0.6870 |
| Daily Pivot Point S1 | 0.6815 |
| Daily Pivot Point S2 | 0.6790 |
| Daily Pivot Point S3 | 0.6750 |
| Daily Pivot Point R1 | 0.6879 |
| Daily Pivot Point R2 | 0.6919 |
| Daily Pivot Point R3 | 0.6943 |
[/s2If]
Download Nehcap EAWe have two EAs that are operational on our LIVE accounts.
- EA-FIX: Check out the details here. Download EA-FIX . EA-FIX is a non-grid HFT scalper.
- EA-GROWTH: High quality low dd EA using trend grids. Download EA_GROWTHJoin Our Telegram Group
")


