During the early Asian session on Monday, the NZDUSD pair faces difficulties in making progress.
…
This is a premium post.
[s2If !current_user_can(access_s2member_level4)]Please register for FREE REGISTER to read full post below containing analysis. In case of any error or you think you are not able to read the full post below, please email us at support#nehcap.com [lwa][/s2If] [s2If current_user_can(access_s2member_level1)]
- NZD/USD struggles to gain ground during the early Asian session on Monday.
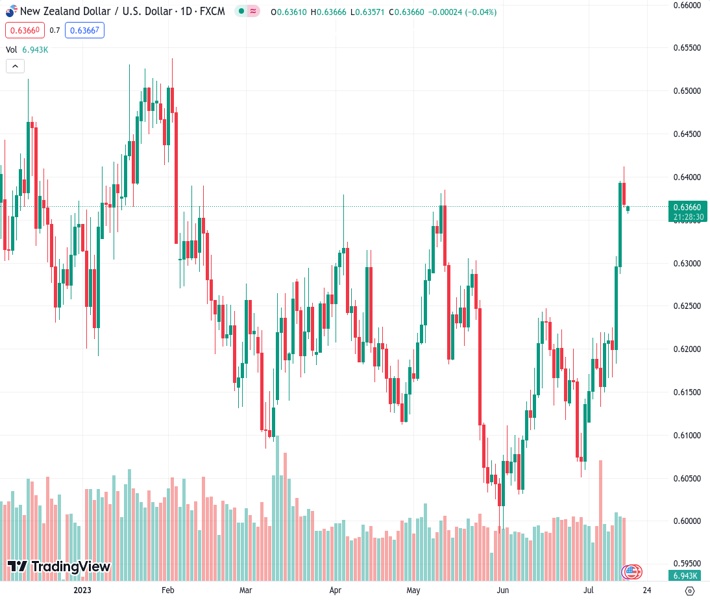
The pair currently trades last at 0.63680.
The previous day high was 0.6413 while the previous day low was 0.6364. The daily 38.2% Fib levels comes at 0.6383, expected to provide resistance. Similarly, the daily 61.8% fib level is at 0.6394, expected to provide resistance.
The NZD/USD pair edges lower around the 0.6360 area in the early Asian session and struggles to capitalize on its uptick to the 0.6400 area on Friday. Markets await the inflation data from New Zealand and the US Retail Sales for June for fresh impetus ahead of the upcoming Federal Open Market Committee (FOMC) meetings.
As expected, the Reserve Bank of New Zealand (RBNZ) kept interest rates unchanged at 5.5%. The last time policymakers left interest rates unchanged was in August 2021.
That said, Thursday’s Chinese data showed that Trade Balance came in at CNY 491.25 billion in June versus CNY 452.33 billion prior. Also, the Dollar value of China’s exports plunged 12.4% in June, missing the market consensus of a 9.5% decline and a 7.5% drop in May. Meanwhile, imports fell 6.8% versus 4.5% prior. The data fuels concerns on an economic slowdown in the world’s second-largest economy, which could be the headwind surrounding the NZD/USD pair, the proxy currency for the Chinese economy.
On the US Dollar front, the University of Michigan’s (UoM) Consumer Confidence Index rose to 72.6 from 64.4 in June, above the market consensus of 65.5. Additionally, the Producer Price Index (PPI) released on Thursday showed the figure came in at 0.1%, worse than the expected 0.2%. The core PPI was 2.4%, below the estimation of 2.6%. Meanwhile, June’s Consumer Price Index (CPI) increased by 3.0% year on year, falling short of the expected 3.1% increase. Furthermore, the Core CPI, which excludes volatile commodities like food and energy, fell by 0.5% last month, dropping from 5.3% in May to 4.8%.
The latest US inflation data showed a sign of cooling inflationary pressure. Economists expected the Fed would be less aggressive in tightening monetary policy, and the next interest rate meeting on July 26 could be the last rate hike.
Looking ahead, market participants will focus on New Zealand’s Consumer Price Index (CPI) data on Wednesday, with the annual rate expected to drop from 6.7% to 5.9%. Also, the US Empire State Manufacturing Index and Retail Sales will be released later in the week. Investors will digest these data as the Federal Reserve (Fed) enters its blackout period ahead of the July 25-26 meeting.
Technical Levels: Supports and Resistances
NZDUSD currently trading at 0.6364 at the time of writing. Pair opened at 0.6369 and is trading with a change of -0.08 % .
| Overview | Overview.1 | |
|---|---|---|
| 0 | Today last price | 0.6364 |
| 1 | Today Daily Change | -0.0005 |
| 2 | Today Daily Change % | -0.0800 |
| 3 | Today daily open | 0.6369 |
The pair remains strongly bullish on the daily timeframe. It trades above its 20 SMA @ 0.619, 50 SMA 0.6175, 100 SMA @ 0.6193 and 200 SMA @ 0.619.
| Trends | Trends.1 | |
|---|---|---|
| 0 | Daily SMA20 | 0.6190 |
| 1 | Daily SMA50 | 0.6175 |
| 2 | Daily SMA100 | 0.6193 |
| 3 | Daily SMA200 | 0.6190 |
The previous day high was 0.6413 while the previous day low was 0.6364. The daily 38.2% Fib levels comes at 0.6383, expected to provide resistance. Similarly, the daily 61.8% fib level is at 0.6394, expected to provide resistance.
Note the levels of interest below:
- Pivot support is noted at 0.6351, 0.6333, 0.6302
- Pivot resistance is noted at 0.64, 0.6431, 0.6449
| Levels | Levels.1 |
|---|---|
| Previous Daily High | 0.6413 |
| Previous Daily Low | 0.6364 |
| Previous Weekly High | 0.6413 |
| Previous Weekly Low | 0.6166 |
| Previous Monthly High | 0.6250 |
| Previous Monthly Low | 0.5990 |
| Daily Fibonacci 38.2% | 0.6383 |
| Daily Fibonacci 61.8% | 0.6394 |
| Daily Pivot Point S1 | 0.6351 |
| Daily Pivot Point S2 | 0.6333 |
| Daily Pivot Point S3 | 0.6302 |
| Daily Pivot Point R1 | 0.6400 |
| Daily Pivot Point R2 | 0.6431 |
| Daily Pivot Point R3 | 0.6449 |
[/s2If]
Download Nehcap EAWe have two EAs that are operational on our LIVE accounts.
- EA-FIX: Check out the details here. Download EA-FIX . EA-FIX is a non-grid HFT scalper.
- EA-GROWTH: High quality low dd EA using trend grids. Download EA_GROWTHJoin Our Telegram Group
")


