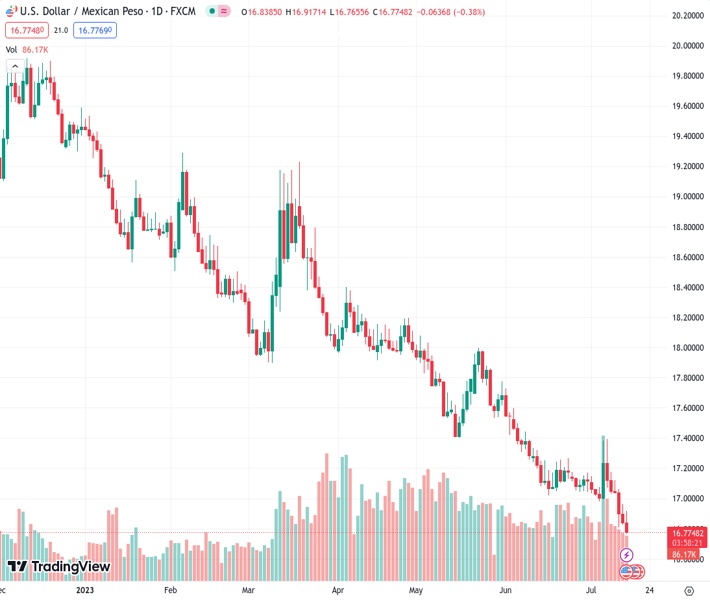
The USDMXN pair continues to decline, dropping below 16.80, as the Mexican Peso gains from the alleviation of US inflation concerns.
…
This is a premium post.
[s2If !current_user_can(access_s2member_level4)]Please register for FREE REGISTER to read full post below containing analysis. In case of any error or you think you are not able to read the full post below, please email us at support#nehcap.com [lwa][/s2If] [s2If current_user_can(access_s2member_level1)]
- USD/MXN extends its losses, falling past the 16.80 mark, as the Mexican Peso benefits from easing US inflation.
The pair currently trades last at 16.7756.
The previous day high was 16.9626 while the previous day low was 16.8252. The daily 38.2% Fib levels comes at 16.8777, expected to provide resistance. Similarly, the daily 61.8% fib level is at 16.9101, expected to provide resistance.
USD/MXN extended its losses past the 16.80 mark, with the Mexican Peso (MXN) eyeing additional gains as inflation in the United States (US) subsides, as revealed during the week. The USD/MXN is exchanging hands at 16.8000, down 0.23%, and set to finish the week with losses of almost 1.90%.
The last week witnessed inflation figures easing in the US. The US Bureau of Labor Statistics (BLS) revealed that Import and Export prices continued their downtrend, falling below May’s and estimate numbers, aligning recent consumer prices and producer prices reports previously showcased on Wednesday and Thursday, respectively. Although the data could be used by the US Federal Reserve (Fed) to pause its tightening cycle, officials remain focused on bringing inflation towards its 2% goal.
Traders expect the US central bank to hike rates 25 bps at the upcoming July Federal Open Market Committee (FOMC) on 25-26, with odds at 96.1%. However, contrary to Fed policymakers saying that an additional increase is needed past the July meeting, the swaps market shows US rates peaking at 5.25%-5.50%.
The University of Michigan (UoM) revealed an improvement in US Consumer Sentiment, which was expected to print 65.5 but came at 72.6m at a two-year high. Further data showed that inflation expectations for one year were upward revised to 3.4% from 3.3% in June, while for five years, it edged high to 3.1%, up from 3%.
Joanne Jsu, the UoM Surveys of Consumers Director, said, “The sharp rise in sentiment was largely attributable to the continued slowdown in inflation along with stability in labor markets.”
US Treasury bond yields are recovering some ground, as the 10-year Treasury note rate sits at 3.816%, gaining four and a half basis points, while the US Dollar Index, a measure of the dollar’s performance against a basket of peers, stopped its drop at 99.887, gaining 0.10%.
Across the border, a light economic calendar in Mexico left USD/MXN traders leaning into the interest rate differential between both countries and recent US inflation data, which could warrant the Fed could finish its tightening cycle.
The USD/MXN monthly chart depicts that the pair might continue to trend lower as the next support emerges at the October 2015 swing low of 16.3267 and the 200-month Exponential Moving Average (EMA) at 16.3138. But firstly, a psychological 16.50 barrier must be taken out by sellers, which should be said, they had no issues taking psychological support levels out of the way, to the downside. Conversely, USD/MXN buyers must claim the July 2017 swing low of 17.4498, so they can have a chance, to lift exchange rates, to the 61.8% Fibonacci retracement at 17.7697, before rallyings toward the 18.0000 figure.
Technical Levels: Supports and Resistances
USDMXN currently trading at 16.8005 at the time of writing. Pair opened at 16.8422 and is trading with a change of -0.25 % .
| Overview | Overview.1 | |
|---|---|---|
| 0 | Today last price | 16.8005 |
| 1 | Today Daily Change | -0.0417 |
| 2 | Today Daily Change % | -0.2500 |
| 3 | Today daily open | 16.8422 |
The pair remains strongly bearish on the daily time frame. It trades below the 20 SMA @ 17.0873, 50 SMA 17.3731, 100 SMA @ 17.8025 and 200 SMA @ 18.563.
| Trends | Trends.1 | |
|---|---|---|
| 0 | Daily SMA20 | 17.0873 |
| 1 | Daily SMA50 | 17.3731 |
| 2 | Daily SMA100 | 17.8025 |
| 3 | Daily SMA200 | 18.5630 |
The previous day high was 16.9626 while the previous day low was 16.8252. The daily 38.2% Fib levels comes at 16.8777, expected to provide resistance. Similarly, the daily 61.8% fib level is at 16.9101, expected to provide resistance.
Note the levels of interest below:
- Pivot support is noted at 16.7908, 16.7393, 16.6534
- Pivot resistance is noted at 16.9282, 17.0141, 17.0655
| Levels | Levels.1 |
|---|---|
| Previous Daily High | 16.9626 |
| Previous Daily Low | 16.8252 |
| Previous Weekly High | 17.3957 |
| Previous Weekly Low | 16.9803 |
| Previous Monthly High | 17.7286 |
| Previous Monthly Low | 17.0243 |
| Daily Fibonacci 38.2% | 16.8777 |
| Daily Fibonacci 61.8% | 16.9101 |
| Daily Pivot Point S1 | 16.7908 |
| Daily Pivot Point S2 | 16.7393 |
| Daily Pivot Point S3 | 16.6534 |
| Daily Pivot Point R1 | 16.9282 |
| Daily Pivot Point R2 | 17.0141 |
| Daily Pivot Point R3 | 17.0655 |
[/s2If]
Download Nehcap EAWe have two EAs that are operational on our LIVE accounts.
- EA-FIX: Check out the details here. Download EA-FIX . EA-FIX is a non-grid HFT scalper.
- EA-GROWTH: High quality low dd EA using trend grids. Download EA_GROWTHJoin Our Telegram Group
")


