The USDJPY pair is experiencing a seven-day consecutive decline and reaches its lowest point in nearly two months on Friday.
…
This is a premium post.
[s2If !current_user_can(access_s2member_level4)]Please register for FREE REGISTER to read full post below containing analysis. In case of any error or you think you are not able to read the full post below, please email us at support#nehcap.com [lwa][/s2If] [s2If current_user_can(access_s2member_level1)]
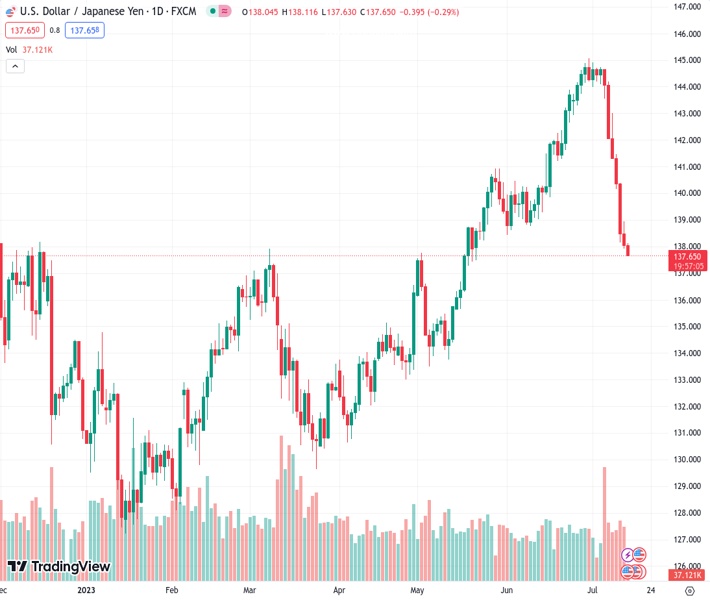
- USD/JPY drifts lower for the seventh straight day and hits a nearly two-month low on Friday.
The pair currently trades last at 137.634.
The previous day high was 138.96 while the previous day low was 137.92. The daily 38.2% Fib levels comes at 139.01, expected to provide resistance. Similarly, the daily 61.8% fib level is at 139.54, expected to provide resistance.
The USD/JPY pair prolongs its recent downfall for the seventh straight day on Friday and drops to a nearly two-month low, around the 137.75 region during the Asian session.
The Japanese Yen (JPY) continues to draw support from growing speculations that the Bank of Japan (BoJ) could tweak its Yield Curve Control (YCC) policy as soon as this month. In contrast, the Federal Reserve (Fed) is expected to hold interest rates after a 25 bps lift-off in July, which keeps the US Dollar (USD) depressed near its lowest level since April 2022 and contributes to the prevailing selling bias surrounding the USD/JPY pair.
Data released recently showed that Japan’s nominal base salary grew at the fastest pace in 28 years in May. This is expected to push inflation higher, which has exceeded the 2% goal for more than a year, and should put pressure on the BoJ to adjust its ultra-loose monetary policy settings. This lifted the yield on the benchmark 10-year Japanese government bond to its highest level since late April on Wednesday and continues to benefit the JPY.
Market participants, meanwhile, now seem convinced that the Fed is nearing the end of its rate hiking cycle. The bets were lifted by the US CPI report on Wednesday, which showed a further moderation in consumer prices. Adding to this, the US Producer Prices Index (PPI) recorded the smallest annual rise in nearly three years in June. This comes on the back of signs that the US labor market is cooling and should allow the Fed to soften its hawkish stance.
This led to the recent sharp decline in the US Treasury bond yields, narrowing the US-Japan rate differential and underpinning the JPY. Apart from this, a modest pullback in the US equity futures might further boost demand for the safe-haven JPY and suggests that the path of least resistance for the USD/JPY pair is to the downside. That said, extremely oversold conditions might hold back traders from placing fresh bearish bets and help limit losses.
Nevertheless, the USD/JPY pair remains on track to register its worst weekly decline since November 2022 and the aforementioned fundamental backdrop remains tilted in favour of bearish traders. Market participants now look to the release of the Preliminary Michigan US Consumer Sentiment Index for some impetus on the last day of the week.
Technical Levels: Supports and Resistances
USDJPY currently trading at 137.79 at the time of writing. Pair opened at 138.05 and is trading with a change of -0.19 % .
| Overview | Overview.1 | |
|---|---|---|
| 0 | Today last price | 137.79 |
| 1 | Today Daily Change | -0.26 |
| 2 | Today Daily Change % | -0.19 |
| 3 | Today daily open | 138.05 |
The pair is trading below its 20 Daily moving average @ 142.79, below its 50 Daily moving average @ 139.99 , above its 100 Daily moving average @ 136.96 and above its 200 Daily moving average @ 137.16
| Trends | Trends.1 | |
|---|---|---|
| 0 | Daily SMA20 | 142.79 |
| 1 | Daily SMA50 | 139.99 |
| 2 | Daily SMA100 | 136.96 |
| 3 | Daily SMA200 | 137.16 |
The previous day high was 138.96 while the previous day low was 137.92. The daily 38.2% Fib levels comes at 139.01, expected to provide resistance. Similarly, the daily 61.8% fib level is at 139.54, expected to provide resistance.
Note the levels of interest below:
- Pivot support is noted at 137.64, 136.78, 135.4
- Pivot resistance is noted at 139.88, 141.25, 142.11
| Levels | Levels.1 |
|---|---|
| Previous Daily High | 138.96 |
| Previous Daily Low | 137.92 |
| Previous Weekly High | 144.91 |
| Previous Weekly Low | 142.07 |
| Previous Monthly High | 145.07 |
| Previous Monthly Low | 138.43 |
| Daily Fibonacci 38.2% | 139.01 |
| Daily Fibonacci 61.8% | 139.54 |
| Daily Pivot Point S1 | 137.64 |
| Daily Pivot Point S2 | 136.78 |
| Daily Pivot Point S3 | 135.40 |
| Daily Pivot Point R1 | 139.88 |
| Daily Pivot Point R2 | 141.25 |
| Daily Pivot Point R3 | 142.11 |
[/s2If]
Download Nehcap EAWe have two EAs that are operational on our LIVE accounts.
- EA-FIX: Check out the details here. Download EA-FIX . EA-FIX is a non-grid HFT scalper.
- EA-GROWTH: High quality low dd EA using trend grids. Download EA_GROWTHJoin Our Telegram Group
")


