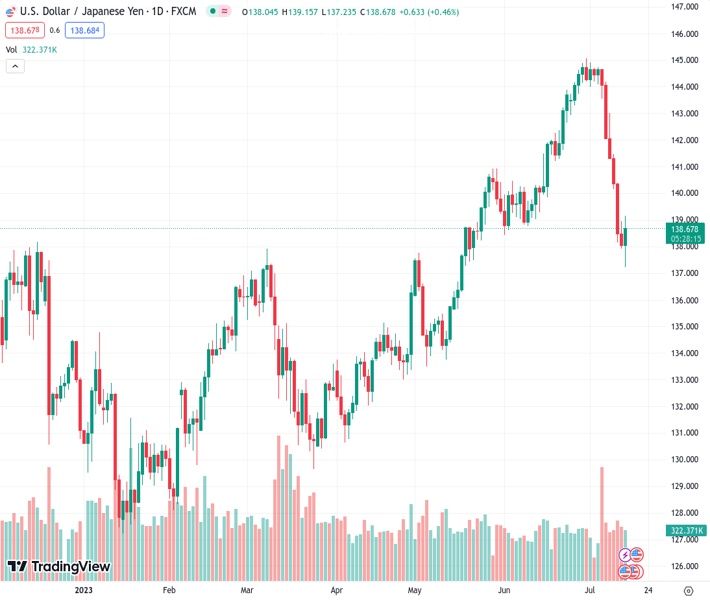
The USDJPY currency pair, trading at 138.642, managed to regain some of its previous value but still faced the risk of giving up its initial progress due to the decelerating rate of inflation in the US.
…
This is a premium post.
[s2If !current_user_can(access_s2member_level4)]Please register for FREE REGISTER to read full post below containing analysis. In case of any error or you think you are not able to read the full post below, please email us at support#nehcap.com [lwa][/s2If] [s2If current_user_can(access_s2member_level1)]
- USD/JPY recovered some ground but remained in danger of losing its early gains due to the slowing pace of inflation in the United States.
The pair currently trades last at 138.642.
The previous day high was 138.96 while the previous day low was 137.92. The daily 38.2% Fib levels comes at 139.01, expected to provide resistance. Similarly, the daily 61.8% fib level is at 139.54, expected to provide resistance.
USD/JPY recovers some ground but remains at the brisk of erasing most of its earlier gains after data from the United States (US) continued to show inflation is decelerating. At the same time, an improvement in US consumer sentiment lifted the pair towards its daily high of 139.15 before reversing its curse. The USD/JPY is trading at 138.47 after hitting a daily low of 137.21, up 0.31%.
The USD/JPY jumped during the latest hour after a report from the University of Michigan (UoM) saw an improvement in Consumer Sentiment, which was expected to print 65.5 but came at 72.6m at a two-year high. Joanne Jsu, the UoM Surveys of Consumers Director, said, “The sharp rise in sentiment was largely attributable to the continued slowdown in inflation along with stability in labor markets.” Additional data showed that inflation expectations for one year were upward revised to 3.4% from 3.3% in June, while for a five-year period, they were 3.1%, up from 3%.
Other data the US Department of Labor revealed showed US Import and Export prices slowed down, falling below the estimates in annual and yearly figures for June. The report aligned with the recent inflation data on the consumer and producer side, with numbers justifying the case for the US Federal Reserve (Fed) to keep rates unchanged if they want to, as prices are accelerating towards the Fed’s 2% goal. Nevertheless, Fed policymakers stressed that the battle against inflation has not been won, suggesting further tightening is needed.
US Treasury bond yields are recovering some ground, as the 10-year Treasury note rate sits at 3.793%, up two basis points, a tailwind for the greenback. The US Dollar Index, a measure of the dollar’s performance against a basket of peers, stopped its drop at 99.809, gaining 0.03%.
On the Japanese front, a Bank of Japan (BoJ) survey showed that households’ inflation expectations had risen, keeping the BoJ pressured. Also, expectations of the BoJ tweaking its Yield Curve Control (YCC) have been the main driver behind the Japanese Yen (JPY) strong week against most G8 FX currencies.
As of writing, the USD/JPY is struggling to decisively break the top of the Ichimoku Cloud (Kumo), which could pave the way for consolidation. USD/JPY’s sellers are eyeing the bottom of the Kumo at around 135.80/90, but the 200-day Exponential Moving Average (EMA) at 136.43 is expected to cushion the USD/JPY fall. On the upside, if USD/JPY buyers lift the pair past the top of the Kumo at around 138.50/60, it would exacerbate a challenge of the 139.00 psychological level.
Technical Levels: Supports and Resistances
USDJPY currently trading at 138.5 at the time of writing. Pair opened at 138.05 and is trading with a change of 0.33 % .
| Overview | Overview.1 | |
|---|---|---|
| 0 | Today last price | 138.50 |
| 1 | Today Daily Change | 0.45 |
| 2 | Today Daily Change % | 0.33 |
| 3 | Today daily open | 138.05 |
The pair is trading below its 20 Daily moving average @ 142.79, below its 50 Daily moving average @ 139.99 , above its 100 Daily moving average @ 136.96 and above its 200 Daily moving average @ 137.16
| Trends | Trends.1 | |
|---|---|---|
| 0 | Daily SMA20 | 142.79 |
| 1 | Daily SMA50 | 139.99 |
| 2 | Daily SMA100 | 136.96 |
| 3 | Daily SMA200 | 137.16 |
The previous day high was 138.96 while the previous day low was 137.92. The daily 38.2% Fib levels comes at 139.01, expected to provide resistance. Similarly, the daily 61.8% fib level is at 139.54, expected to provide resistance.
Note the levels of interest below:
- Pivot support is noted at 137.64, 136.78, 135.4
- Pivot resistance is noted at 139.88, 141.25, 142.11
| Levels | Levels.1 |
|---|---|
| Previous Daily High | 138.96 |
| Previous Daily Low | 137.92 |
| Previous Weekly High | 144.91 |
| Previous Weekly Low | 142.07 |
| Previous Monthly High | 145.07 |
| Previous Monthly Low | 138.43 |
| Daily Fibonacci 38.2% | 139.01 |
| Daily Fibonacci 61.8% | 139.54 |
| Daily Pivot Point S1 | 137.64 |
| Daily Pivot Point S2 | 136.78 |
| Daily Pivot Point S3 | 135.40 |
| Daily Pivot Point R1 | 139.88 |
| Daily Pivot Point R2 | 141.25 |
| Daily Pivot Point R3 | 142.11 |
[/s2If]
Download Nehcap EAWe have two EAs that are operational on our LIVE accounts.
- EA-FIX: Check out the details here. Download EA-FIX . EA-FIX is a non-grid HFT scalper.
- EA-GROWTH: High quality low dd EA using trend grids. Download EA_GROWTHJoin Our Telegram Group
")


