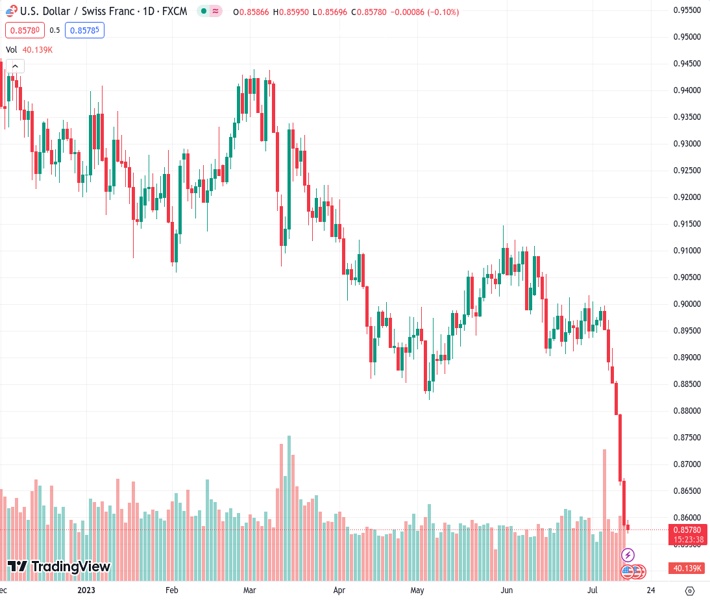
The USDCHF pair is trading at 0.85781 and continues to struggle at its lowest levels since January 2015. According to the viewpoint of Nehcap, any further decline is expected to be limited.
…
This is a premium post.
[s2If !current_user_can(access_s2member_level4)]Please register for FREE REGISTER to read full post below containing analysis. In case of any error or you think you are not able to read the full post below, please email us at support#nehcap.com [lwa][/s2If] [s2If current_user_can(access_s2member_level1)]
- USD/CHF remains on the back foot at the lowest levels since January 2015.
The pair currently trades last at 0.85781.
The previous day high was 0.8676 while the previous day low was 0.8582. The daily 38.2% Fib levels comes at 0.8713, expected to provide resistance. Similarly, the daily 61.8% fib level is at 0.8746, expected to provide resistance.
USD/CHF bears keep the reins at the lowest levels since January 2015, down 0.12% intraday near 0.8575 heading into Friday’s European session.
In doing so, the Swiss Franc pair drops for the seventh consecutive day while refreshing the multi-year low. However, the oversold RSI conditions join the bottom line of a downward-sloping trend channel established in December 2022, around 0.8570, to challenge the USD/CHF bears.
In a case where the pair sellers ignore the oversold RSI conditions and defy the bearish chart pattern by breaking the 0.8570 support, the late January 2015 swing low of around 0.8500 may act as the last defense before directing the quote to the year 2015 bottom of 0.8300.
Meanwhile, USD/CHF recovery may aim for the 0.8600 and 0.8700 round figure but the bulls remain off the table unless witnessing a daily closing beyond May’s low of 0.8820.
Even so, the aforementioned multi-month-old bearish channel’s top line, close to 0.8990 at the latest, prods the pair buyers before giving them control.
It should be observed that the 0.9000 psychological magnet and the 100-DMA are extra filters toward the north.
Overall, USD/CHF remains bearish but the sellers appear running out of steam of late, which in turn suggests a corrective bounce in prices.
Trend: Limited downside expected
Technical Levels: Supports and Resistances
USDCHF currently trading at 0.8577 at the time of writing. Pair opened at 0.8588 and is trading with a change of -0.13% % .
| Overview | Overview.1 | |
|---|---|---|
| 0 | Today last price | 0.8577 |
| 1 | Today Daily Change | -0.0011 |
| 2 | Today Daily Change % | -0.13% |
| 3 | Today daily open | 0.8588 |
The pair remains strongly bearish on the daily time frame. It trades below the 20 SMA @ 0.8927, 50 SMA 0.8976, 100 SMA @ 0.9056 and 200 SMA @ 0.9266.
| Trends | Trends.1 | |
|---|---|---|
| 0 | Daily SMA20 | 0.8927 |
| 1 | Daily SMA50 | 0.8976 |
| 2 | Daily SMA100 | 0.9056 |
| 3 | Daily SMA200 | 0.9266 |
The previous day high was 0.8676 while the previous day low was 0.8582. The daily 38.2% Fib levels comes at 0.8713, expected to provide resistance. Similarly, the daily 61.8% fib level is at 0.8746, expected to provide resistance.
Note the levels of interest below:
- Pivot support is noted at 0.8622, 0.857, 0.8481
- Pivot resistance is noted at 0.8764, 0.8852, 0.8905
| Levels | Levels.1 |
|---|---|
| Previous Daily High | 0.8676 |
| Previous Daily Low | 0.8582 |
| Previous Weekly High | 0.9005 |
| Previous Weekly Low | 0.8876 |
| Previous Monthly High | 0.9120 |
| Previous Monthly Low | 0.8902 |
| Daily Fibonacci 38.2% | 0.8713 |
| Daily Fibonacci 61.8% | 0.8746 |
| Daily Pivot Point S1 | 0.8622 |
| Daily Pivot Point S2 | 0.8570 |
| Daily Pivot Point S3 | 0.8481 |
| Daily Pivot Point R1 | 0.8764 |
| Daily Pivot Point R2 | 0.8852 |
| Daily Pivot Point R3 | 0.8905 |
[/s2If]
Download Nehcap EAWe have two EAs that are operational on our LIVE accounts.
- EA-FIX: Check out the details here. Download EA-FIX . EA-FIX is a non-grid HFT scalper.
- EA-GROWTH: High quality low dd EA using trend grids. Download EA_GROWTHJoin Our Telegram Group
")


