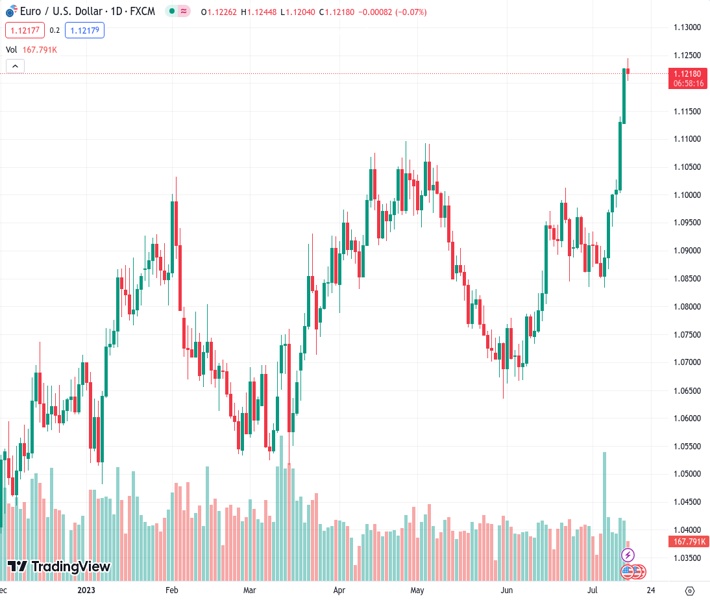
The price of EURUSD has risen to reach new highs within the range of 1.1240 to 1.1245.
…
This is a premium post.
[s2If !current_user_can(access_s2member_level4)]Please register for FREE REGISTER to read full post below containing analysis. In case of any error or you think you are not able to read the full post below, please email us at support#nehcap.com [lwa][/s2If] [s2If current_user_can(access_s2member_level1)]
- EUR/USD advances to new highs in the 1.1240/45 band.
The pair currently trades last at 1.12393.
The previous day high was 1.1228 while the previous day low was 1.1128. The daily 38.2% Fib levels comes at 1.1089, expected to provide support. Similarly, the daily 61.8% fib level is at 1.1057, expected to provide support.
EUR/USD’s intense upside seems to have met an initial barrier around 1.1240, or 2023 peaks, so far on Friday.
While the continuation of the upside momentum appears favoured in the very near term, the pair’s current overbought conditions might spark a corrective knee-jerk. Further upside is then expected to meet the next resistance level of note at the 2022 high of 1.1495 recorded on February 10.
Looking at the longer run, the positive view remains unchanged while above the 200-day SMA, today at 1.0651.
Technical Levels: Supports and Resistances
EURUSD currently trading at 1.1228 at the time of writing. Pair opened at 1.1226 and is trading with a change of 0.02 % .
| Overview | Overview.1 | |
|---|---|---|
| 0 | Today last price | 1.1228 |
| 1 | Today Daily Change | 40.0000 |
| 2 | Today Daily Change % | 0.0200 |
| 3 | Today daily open | 1.1226 |
The pair remains strongly bullish on the daily timeframe. It trades above its 20 SMA @ 1.0938, 50 SMA 1.0861, 100 SMA @ 1.0841 and 200 SMA @ 1.0638.
| Trends | Trends.1 | |
|---|---|---|
| 0 | Daily SMA20 | 1.0938 |
| 1 | Daily SMA50 | 1.0861 |
| 2 | Daily SMA100 | 1.0841 |
| 3 | Daily SMA200 | 1.0638 |
The previous day high was 1.1228 while the previous day low was 1.1128. The daily 38.2% Fib levels comes at 1.1089, expected to provide support. Similarly, the daily 61.8% fib level is at 1.1057, expected to provide support.
Note the levels of interest below:
- Pivot support is noted at 1.1044, 1.0956, 1.0908
- Pivot resistance is noted at 1.1179, 1.1228, 1.1315
| Levels | Levels.1 |
|---|---|
| Previous Daily High | 1.1228 |
| Previous Daily Low | 1.1128 |
| Previous Weekly High | 1.0973 |
| Previous Weekly Low | 1.0834 |
| Previous Monthly High | 1.1012 |
| Previous Monthly Low | 1.0662 |
| Daily Fibonacci 38.2% | 1.1089 |
| Daily Fibonacci 61.8% | 1.1057 |
| Daily Pivot Point S1 | 1.1044 |
| Daily Pivot Point S2 | 1.0956 |
| Daily Pivot Point S3 | 1.0908 |
| Daily Pivot Point R1 | 1.1179 |
| Daily Pivot Point R2 | 1.1228 |
| Daily Pivot Point R3 | 1.1315 |
[/s2If]
Download Nehcap EAWe have two EAs that are operational on our LIVE accounts.
- EA-FIX: Check out the details here. Download EA-FIX . EA-FIX is a non-grid HFT scalper.
- EA-GROWTH: High quality low dd EA using trend grids. Download EA_GROWTHJoin Our Telegram Group
")


