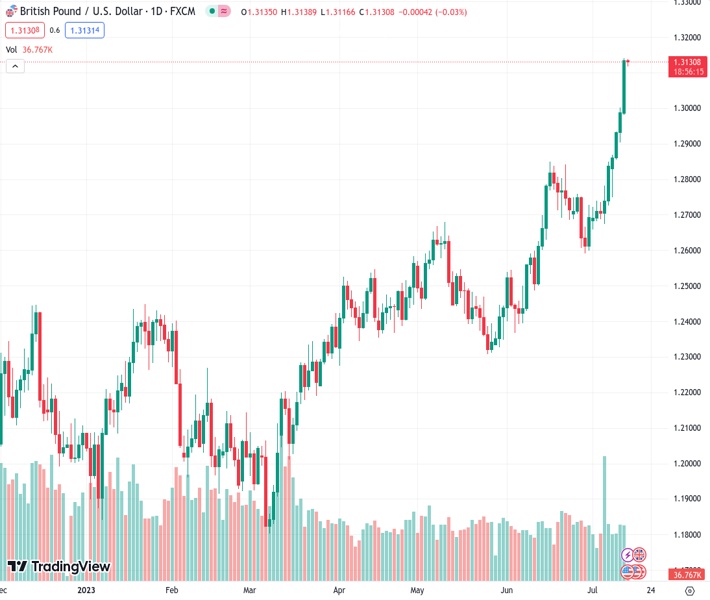
The GBPUSD currency pair is currently at a rate of 1.31299 and is experiencing a period of consolidation, indicating a bullish trend. It is trading slightly below its highest level in the past 15 months.
…
This is a premium post.
[s2If !current_user_can(access_s2member_level4)]Please register for FREE REGISTER to read full post below containing analysis. In case of any error or you think you are not able to read the full post below, please email us at support#nehcap.com [lwa][/s2If] [s2If current_user_can(access_s2member_level1)]
- GBP/USD enters a bullish consolidation phase and trades just below the 15-month peak.
The pair currently trades last at 1.31299.
The previous day high was 1.3141 while the previous day low was 1.2984. The daily 38.2% Fib levels comes at 1.2964, expected to provide support. Similarly, the daily 61.8% fib level is at 1.2941, expected to provide support.
The GBP/USD pair oscillates in a narrow trading band during the Asian session on Friday and consolidates its recent strong gains registered over the past two weeks or so, to its highest level since April 2022. Spot prices currently trade around the 1.3130-1.3125 region and the fundamental backdrop still seems tilted firmly in favour of bullish traders.
The US Dollar (USD) remains under some selling pressure for the seventh straight day and hits a fresh 15-month low in the wake of firming expectations that the Federal Reserve (Fed) is nearly done with its policy tightening cycle. The British Pound (GBP), on the other hand, continues to draw support from rising bets that the Bank of England (BoE) may need to raise interest rates further to combat high inflation. This should act as a tailwind for the GBP/USD pair and support prospects for an extension of the near-term well-established uptrend.
Investors seem convinced that the US central bank will hold interest rates steady for the rest of the year after the widely expected 25 bps lift-off in July. The bets were lifted by the US CPI report on Wednesday, which showed a further moderation in consumer prices. Adding to this, the US Producer Prices Index (PPI) recorded the smallest annual rise in nearly three years in June. This comes on the back of signs that the US labor market is cooling and should allow the Fed to soften its hawkish stance, which keeps the USD bulls on the defensive.
In contrast, the current market pricing indicates that the BoE could raise interest rates from the current 5% to a cycle peak of 6.5% to dampen demand and force inflation lower. The speculations were fueled by stronger UK wage growth data, which, according to BoE Governor Andrew Bailey and UK Finance Minister Jeremy Hunt, is harming the efforts to contain inflation. This, to a larger extent, helps offset the possibility of a recession in the UK later this year and suggests that the path of least resistance for the GBP/USD pair remains to the upside.
There isn’t any relevant market-moving economic data due from the UK on Friday, leaving the major at the mercy of the USD price dynamics. Later during the early North American session, traders will take cues from the release of the Preliminary Michigan US Consumer Sentiment Index. This, along with the broader risk sentiment, might influence the USD and provide some impetus to the GBP/USD pair on the last trading day of the week. Nevertheless, spot prices remain on track to register strong gains and end in the green for the second straight week.
Technical Levels: Supports and Resistances
GBPUSD currently trading at 1.3132 at the time of writing. Pair opened at 1.3136 and is trading with a change of -0.03 % .
| Overview | Overview.1 | |
|---|---|---|
| 0 | Today last price | 1.3132 |
| 1 | Today Daily Change | -0.0004 |
| 2 | Today Daily Change % | -0.0300 |
| 3 | Today daily open | 1.3136 |
The pair remains strongly bullish on the daily timeframe. It trades above its 20 SMA @ 1.2764, 50 SMA 1.2599, 100 SMA @ 1.2438 and 200 SMA @ 1.2181.
| Trends | Trends.1 | |
|---|---|---|
| 0 | Daily SMA20 | 1.2764 |
| 1 | Daily SMA50 | 1.2599 |
| 2 | Daily SMA100 | 1.2438 |
| 3 | Daily SMA200 | 1.2181 |
The previous day high was 1.3141 while the previous day low was 1.2984. The daily 38.2% Fib levels comes at 1.2964, expected to provide support. Similarly, the daily 61.8% fib level is at 1.2941, expected to provide support.
Note the levels of interest below:
- Pivot support is noted at 1.2927, 1.2867, 1.283
- Pivot resistance is noted at 1.3024, 1.306, 1.312
| Levels | Levels.1 |
|---|---|
| Previous Daily High | 1.3141 |
| Previous Daily Low | 1.2984 |
| Previous Weekly High | 1.2850 |
| Previous Weekly Low | 1.2659 |
| Previous Monthly High | 1.2848 |
| Previous Monthly Low | 1.2369 |
| Daily Fibonacci 38.2% | 1.2964 |
| Daily Fibonacci 61.8% | 1.2941 |
| Daily Pivot Point S1 | 1.2927 |
| Daily Pivot Point S2 | 1.2867 |
| Daily Pivot Point S3 | 1.2830 |
| Daily Pivot Point R1 | 1.3024 |
| Daily Pivot Point R2 | 1.3060 |
| Daily Pivot Point R3 | 1.3120 |
[/s2If]
Download Nehcap EAWe have two EAs that are operational on our LIVE accounts.
- EA-FIX: Check out the details here. Download EA-FIX . EA-FIX is a non-grid HFT scalper.
- EA-GROWTH: High quality low dd EA using trend grids. Download EA_GROWTHJoin Our Telegram Group
")


