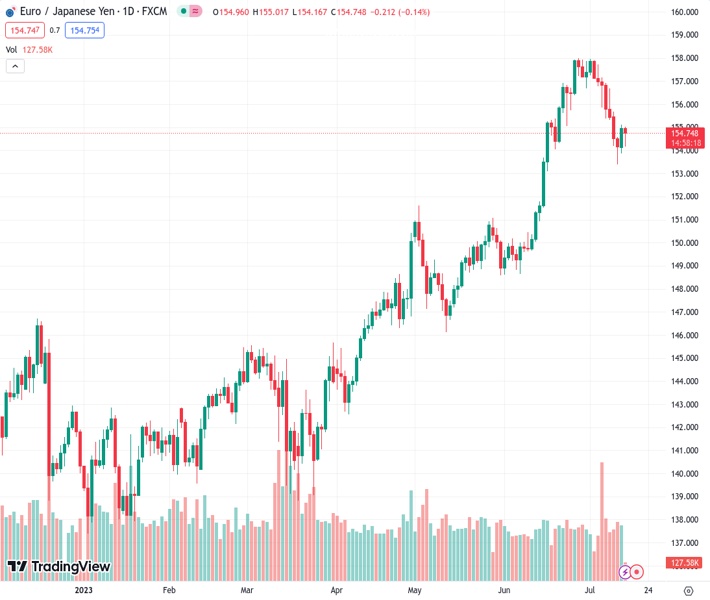
The EURJPY currency pair is seeing increased buying interest after hitting its lowest level for the day, and it is now trading within a range, recovering some of its earlier losses on the daily chart.
…
This is a premium post.
[s2If !current_user_can(access_s2member_level4)]Please register for FREE REGISTER to read full post below containing analysis. In case of any error or you think you are not able to read the full post below, please email us at support#nehcap.com [lwa][/s2If] [s2If current_user_can(access_s2member_level1)]
- EUR/JPY picks up bids from intraday low, consolidates losses on D1.
The pair currently trades last at 154.689.
The previous day high was 155.13 while the previous day low was 153.88. The daily 38.2% Fib levels comes at 153.86, expected to provide support. Similarly, the daily 61.8% fib level is at 154.12, expected to provide support.
EUR/JPY recovers from the intraday low but stays mildly offered near 154.80 heading into Friday’s European session. In doing so, the cross-currency pair traces the latest corrective bounce in the Treasury bond yields, as well as justifies the downbeat Japan data, amid sluggish trading hours.
That said, the US 10-year and two-year Treasury bond yields print mild gains around 3.78% and 4.65% by the press time, after refreshing a two-week low the previous day. It should be noted that Japan Government Bond (JGB) yields for 10-year retreat from 11-week high while those from Europe and Germany await the opening bell.
Elsewhere, Japan’s Industrial Production for May dropped to -2.2% MoM and 4.2% YoY versus -1.6% and 4.7% respectively priors. Additionally, Capacity Utilization slumps to -6.3% compared to -2.5% market forecasts and 3.0% previous readings.
On the flip side, Eurozone Industrial Production eased to 0.2% MoM for May on a seasonally adjusted basis versus 0.3% market forecasts and 1.0% previous readings. It should be noted, however, that the European Central Bank’s (ECB) June policy meeting revealed on Thursday that minimum of two successive rate hikes needed for inflation projections to materialize. Alternatively, ECB Governing Council member Ignazio Visco said during an interview with Italy’s Sky TG24 news channel, “We are not very far’ from peak in interest rates.”
Amid these plays, markets in the Asia-Pacific region remain firmer but the S&P500 Futures print mild losses while making rounds to yearly top.
It’s worth noting that the recent easing chatters about Japan’s intervention to defend the Yen also allow the EUR/JPY pair to portray the corrective bounce.
Looking ahead, European Commission (EC) Economic Forecasts and trade numbers may direct the traders.
Unless crossing a downward-sloping resistance line from July 04, close to 155.40 by the press time, the EUR/JPY pair remains on the bear’s radar.
Technical Levels: Supports and Resistances
EURJPY currently trading at 154.77 at the time of writing. Pair opened at 154.98 and is trading with a change of -0.14% % .
| Overview | Overview.1 | |
|---|---|---|
| 0 | Today last price | 154.77 |
| 1 | Today Daily Change | -0.21 |
| 2 | Today Daily Change % | -0.14% |
| 3 | Today daily open | 154.98 |
The pair is trading below its 20 Daily moving average @ 156.18, above its 50 Daily moving average @ 152.05 , above its 100 Daily moving average @ 148.48 and above its 200 Daily moving average @ 145.78
| Trends | Trends.1 | |
|---|---|---|
| 0 | Daily SMA20 | 156.18 |
| 1 | Daily SMA50 | 152.05 |
| 2 | Daily SMA100 | 148.48 |
| 3 | Daily SMA200 | 145.78 |
The previous day high was 155.13 while the previous day low was 153.88. The daily 38.2% Fib levels comes at 153.86, expected to provide support. Similarly, the daily 61.8% fib level is at 154.12, expected to provide support.
Note the levels of interest below:
- Pivot support is noted at 153.51, 152.91, 152.4
- Pivot resistance is noted at 154.63, 155.15, 155.75
| Levels | Levels.1 |
|---|---|
| Previous Daily High | 155.13 |
| Previous Daily Low | 153.88 |
| Previous Weekly High | 157.96 |
| Previous Weekly Low | 155.38 |
| Previous Monthly High | 158.00 |
| Previous Monthly Low | 148.62 |
| Daily Fibonacci 38.2% | 153.86 |
| Daily Fibonacci 61.8% | 154.12 |
| Daily Pivot Point S1 | 153.51 |
| Daily Pivot Point S2 | 152.91 |
| Daily Pivot Point S3 | 152.40 |
| Daily Pivot Point R1 | 154.63 |
| Daily Pivot Point R2 | 155.15 |
| Daily Pivot Point R3 | 155.75 |
[/s2If]
Download Nehcap EAWe have two EAs that are operational on our LIVE accounts.
- EA-FIX: Check out the details here. Download EA-FIX . EA-FIX is a non-grid HFT scalper.
- EA-GROWTH: High quality low dd EA using trend grids. Download EA_GROWTHJoin Our Telegram Group
")


