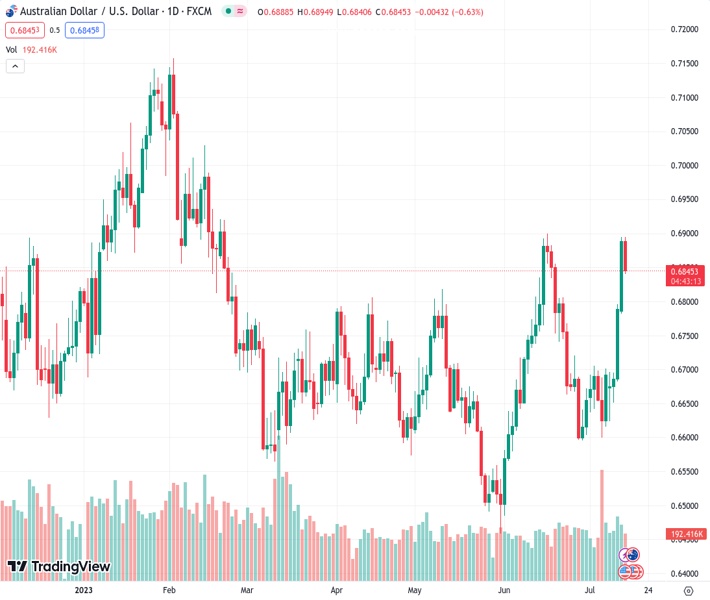
The AUDUSD pair, currently at 0.68431, has fallen below the 0.6850 mark. However, it is still expected to achieve a weekly gain of 2.40%, which would be its highest performance in the year 2023.
…
This is a premium post.
[s2If !current_user_can(access_s2member_level4)]Please register for FREE REGISTER to read full post below containing analysis. In case of any error or you think you are not able to read the full post below, please email us at support#nehcap.com [lwa][/s2If] [s2If current_user_can(access_s2member_level1)]
- AUD/USD retreats below 0.6850, still poised to make a 2.40% weekly gain, its highest in 2023.
The pair currently trades last at 0.68431.
The previous day high was 0.6895 while the previous day low was 0.6785. The daily 38.2% Fib levels comes at 0.6853, expected to provide resistance. Similarly, the daily 61.8% fib level is at 0.6827, expected to provide support.
At the end of the week, the Aussie lost some ground agains the Greenback as US Treasury yields somewhat recovered, lending the USD support. However, the pair is set to see further upside as it is expected the Federal Reserve (Fed) will tilt more dovish following soft inflation data from June.
In a tough week for the USD it was reported that the Core Consumer Price Index (CPI) from the US from June, dropped to 4.8% YoY in June, while the Core Producer Price Index (PPI) slid to 2.6% YoY in the same period. As markets seem to be taking off the table another rate hike past the July meeting, US Treasury yields declined, making the USD face severe selling pressure.
On the data front, the University of Michigan (UoM) reported that its Consumer Confidence Index increased to 72.6 in July from it previous 65.5 and provided some support for the USD.
On the Aussie’s side, investors await labor market data next week, including the Employment Change and Unemployment rate figures from June to be released next Thursday. In addition, investors should keep an eye on China’s situation as it is expected that the Chinese government will announce stimulus measures to bolster the economy. Regarding the Reserve Bank of Australia (RBA), Deputy Governor Bullock was appointed as the new Governor to replace Governor Lowe and her term is set to begin in September 18.
Despite Friday’s downside movements, the AUD/USD’s outlook is bullish for the short term. The Relative Strength Index (RSI) and Moving Average Convergence Divergence (MACD) stand strong in positive territory while the pair trades above the 20, 100 and 200-day Simple Moving Averages.
Resistance Levels: 0.6900 (June high), 0.6950,0.6980.
Support Levels: 0.6785, 0.6750, 0.6715 (20-day Simple Moving Average).
Technical Levels: Supports and Resistances
AUDUSD currently trading at 0.6847 at the time of writing. Pair opened at 0.6889 and is trading with a change of -0.61 % .
| Overview | Overview.1 | |
|---|---|---|
| 0 | Today last price | 0.6847 |
| 1 | Today Daily Change | -0.0042 |
| 2 | Today Daily Change % | -0.6100 |
| 3 | Today daily open | 0.6889 |
The pair remains strongly bullish on the daily timeframe. It trades above its 20 SMA @ 0.6718, 50 SMA 0.6681, 100 SMA @ 0.6683 and 200 SMA @ 0.6701.
| Trends | Trends.1 | |
|---|---|---|
| 0 | Daily SMA20 | 0.6718 |
| 1 | Daily SMA50 | 0.6681 |
| 2 | Daily SMA100 | 0.6683 |
| 3 | Daily SMA200 | 0.6701 |
The previous day high was 0.6895 while the previous day low was 0.6785. The daily 38.2% Fib levels comes at 0.6853, expected to provide resistance. Similarly, the daily 61.8% fib level is at 0.6827, expected to provide support.
Note the levels of interest below:
- Pivot support is noted at 0.6818, 0.6747, 0.6708
- Pivot resistance is noted at 0.6927, 0.6966, 0.7037
| Levels | Levels.1 |
|---|---|
| Previous Daily High | 0.6895 |
| Previous Daily Low | 0.6785 |
| Previous Weekly High | 0.6705 |
| Previous Weekly Low | 0.6599 |
| Previous Monthly High | 0.6900 |
| Previous Monthly Low | 0.6484 |
| Daily Fibonacci 38.2% | 0.6853 |
| Daily Fibonacci 61.8% | 0.6827 |
| Daily Pivot Point S1 | 0.6818 |
| Daily Pivot Point S2 | 0.6747 |
| Daily Pivot Point S3 | 0.6708 |
| Daily Pivot Point R1 | 0.6927 |
| Daily Pivot Point R2 | 0.6966 |
| Daily Pivot Point R3 | 0.7037 |
[/s2If]
Download Nehcap EAWe have two EAs that are operational on our LIVE accounts.
- EA-FIX: Check out the details here. Download EA-FIX . EA-FIX is a non-grid HFT scalper.
- EA-GROWTH: High quality low dd EA using trend grids. Download EA_GROWTHJoin Our Telegram Group
")


