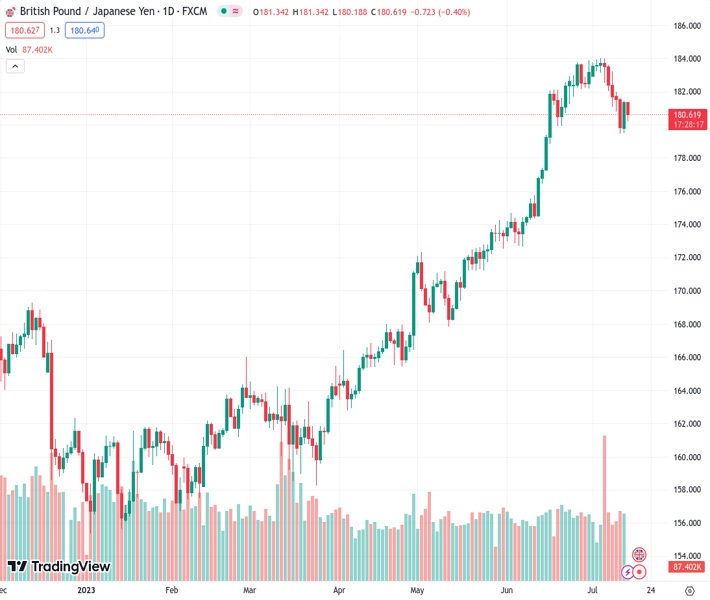
GBPJPY is trading at 180.608 and is maintaining its position around the 180.60 region, experiencing a decrease of 0.33% throughout the day.
…
This is a premium post.
[s2If !current_user_can(access_s2member_level4)]Please register for FREE REGISTER to read full post below containing analysis. In case of any error or you think you are not able to read the full post below, please email us at support#nehcap.com [lwa][/s2If] [s2If current_user_can(access_s2member_level1)]
- GBP/JPY holds the ground near 180.60 area, down 0.33% on the day.
The pair currently trades last at 180.608.
The previous day high was 181.47 while the previous day low was 179.5. The daily 38.2% Fib levels comes at 180.27, expected to provide support. Similarly, the daily 61.8% fib level is at 180.76, expected to provide resistance.
The GBP/JPY pair hovers around the 180.60 mark in the Asian session on Friday. The cross struggles to gain traction after retreating from the 181.40 region.
It’s worth noting that the Relative Strength Index (RSI) is located in the 40-60 zone, indicating the non-directional movement of the pair. However, the 25-hour Exponential Moving Average (EMA) is on the verge of crossing the 50-hour EMA. If a decisive crossover occurs on the one-hour chart. It would validate a Bull Cross highlighting the path of least resistance for the cross is to the upside.
GBP/JPY’s key resistance emerges at 180.80, representing a confluence of the 25- and 50-hour EMA. Any meaningful follow-through buying could pave the way to the next hurdle at 181.40 (High of July 13) en route to 182.00 (psychological level, High of July 11). A convincing break above the latter will trigger a rally to 182.65 (Low of July 6).
On the flip side, the critical support level to watch is at 180.00, the confluence of psychological round mark and a low of July 13. A breach of the mentioned level, further downside is expected. The next contention is seen at 179.55 (low of July 12), followed by 178.80 (low of June 16), and finally at 178.20 (low of June 15).
Technical Levels: Supports and Resistances
GBPJPY currently trading at 180.68 at the time of writing. Pair opened at 181.34 and is trading with a change of -0.36 % .
| Overview | Overview.1 | |
|---|---|---|
| 0 | Today last price | 180.68 |
| 1 | Today Daily Change | -0.66 |
| 2 | Today Daily Change % | -0.36 |
| 3 | Today daily open | 181.34 |
The pair is trading below its 20 Daily moving average @ 182.23, above its 50 Daily moving average @ 176.4 , above its 100 Daily moving average @ 170.4 and above its 200 Daily moving average @ 166.97
| Trends | Trends.1 | |
|---|---|---|
| 0 | Daily SMA20 | 182.23 |
| 1 | Daily SMA50 | 176.40 |
| 2 | Daily SMA100 | 170.40 |
| 3 | Daily SMA200 | 166.97 |
The previous day high was 181.47 while the previous day low was 179.5. The daily 38.2% Fib levels comes at 180.27, expected to provide support. Similarly, the daily 61.8% fib level is at 180.76, expected to provide resistance.
Note the levels of interest below:
- Pivot support is noted at 179.05, 178.22, 176.96
- Pivot resistance is noted at 181.14, 182.39, 183.23
| Levels | Levels.1 |
|---|---|
| Previous Daily High | 181.47 |
| Previous Daily Low | 179.50 |
| Previous Weekly High | 184.02 |
| Previous Weekly Low | 182.02 |
| Previous Monthly High | 183.88 |
| Previous Monthly Low | 172.67 |
| Daily Fibonacci 38.2% | 180.27 |
| Daily Fibonacci 61.8% | 180.76 |
| Daily Pivot Point S1 | 179.05 |
| Daily Pivot Point S2 | 178.22 |
| Daily Pivot Point S3 | 176.96 |
| Daily Pivot Point R1 | 181.14 |
| Daily Pivot Point R2 | 182.39 |
| Daily Pivot Point R3 | 183.23 |
[/s2If]
Download Nehcap EAWe have two EAs that are operational on our LIVE accounts.
- EA-FIX: Check out the details here. Download EA-FIX . EA-FIX is a non-grid HFT scalper.
- EA-GROWTH: High quality low dd EA using trend grids. Download EA_GROWTHJoin Our Telegram Group
")


