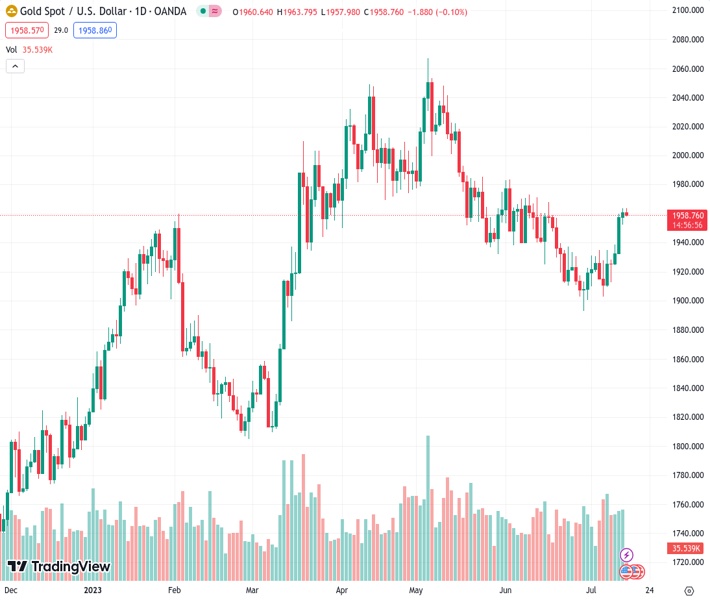
Despite a significant decrease in the USD Index, the price of gold is fluctuating around $1,960.00.
…
This is a premium post.
[s2If !current_user_can(access_s2member_level4)]Please register for FREE REGISTER to read full post below containing analysis. In case of any error or you think you are not able to read the full post below, please email us at support#nehcap.com [lwa][/s2If] [s2If current_user_can(access_s2member_level1)]
- Gold price is demonstrating back-and-forth moves around $1,960.00 despite a steep fall in the USD Index.
Gold price (XAU/USD) is demonstrating a non-directional performance from Thursday after a stalwart rally to near $1,960.00. The precious metal has failed to capitalize on soft inflation and Producer Price Index (PPI) June report, which cleared that households’ demand has turned subdued and the path towards the 2% inflation target is intact.
In spite of a heavy decline in the US Dollar Index (DXY), Gold price is struggling to come out of the woods. The US Dollar Index has surrendered the psychological cushion of 100.00 and has dropped to o near 99.65. Rising hopes of only one interest rate hike announcement from the Federal Reserve (Fed) by the year-end have sent the USD Index extremely lower.
Contrary to investors’ expectations, Fed Governor Christopher Waller is confident that two more interest rate hikes are appropriate this year to bring down inflation to 2%. Hawkish commentary from Fed Waller has infused some strength in the US Treasury yields. The yields offered on 10-year US Treasury bonds have jumped to near 3.77%.
FXStreet’s Technical Confluence Indicator is displaying that the Gold price is consolidating around $1,960.00 and the upside bias could strengthen if it manages to deliver a decisive break above the previous day high (PDH) at $1,964.00.
A strong break above PDH would expose the precious metal to $1,972.25, which is the first pivot resistance on a monthly basis and the third pivot cap on a weekly basis. More upside will open post a solid breakout of monthly R1 and the asset will find its next stoppage at $1,984.48, which is the previous month’s high.
The downside bias could unlock if the Gold price fails to sustain above $1,953.89 which is a daily 23.6% Fibonacci retracement. A slippage below the aforementioned support would drag the asset toward the daily 38.2% Fibo retracement plotted at $1,949.81, followed by a four-hour middle Bollinger Band at $1,939.62.
The TCD (Technical Confluences Detector) is a tool to locate and point out those price levels where there is a congestion of indicators, moving averages, Fibonacci levels, Pivot Points, etc. If you are a short-term trader, you will find entry points for counter-trend strategies and hunt a few points at a time. If you are a medium-to-long-term trader, this tool will allow you to know in advance the price levels where a medium-to-long-term trend may stop and rest, where to unwind positions, or where to increase your position size.
[/s2If]
Download Nehcap EAWe have two EAs that are operational on our LIVE accounts.
- EA-FIX: Check out the details here. Download EA-FIX . EA-FIX is a non-grid HFT scalper.
- EA-GROWTH: High quality low dd EA using trend grids. Download EA_GROWTHJoin Our Telegram Group
")


