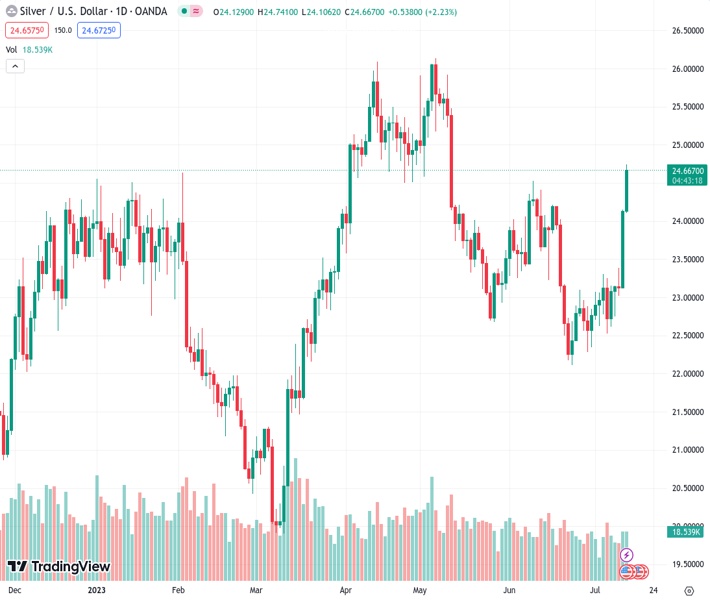
The XAGUSD pair experiences a significant increase of over 2% in value, rising to around $24.70.
…
This is a premium post.
[s2If !current_user_can(access_s2member_level4)]Please register for FREE REGISTER to read full post below containing analysis. In case of any error or you think you are not able to read the full post below, please email us at support#nehcap.com [lwa][/s2If] [s2If current_user_can(access_s2member_level1)]
- The XAG/USD records more than 2% gains on the day, jumping to the $24.70 area.
The pair currently trades last at 24.666.
The previous day high was 24.15 while the previous day low was 23.12. The daily 38.2% Fib levels comes at 23.76, expected to provide support. Similarly, the daily 61.8% fib level is at 23.51, expected to provide support.
The XAG/USD recorded a fifth consecutive day of gains and jumped to its highest level since mid-May towards the $24.70 area. In that sense, following soft Consumer Price Index (CPI) and Produce Price Index (PPI) data from the US, investors refrain from betting on an additional hike from the Federal Reserve (Fed) past June which made the US yields decline across the board.
The Producer Price Index (PPI) came in at 0.1% MoM lower than the 0.2% expected, while the Core Figure came in at 2.4%, failing to match the expectations of 2.6%. In addition, US Jobless Claims for the week ending on July 7 decelerated. The number of people filing first-time claims for state unemployment insurance came in at 237K, lower than the consensus of 250K and its previous figure of 249K.
The US Treasury yields, which could be seen as the opportunity cost of holding non-yielding metals, continue to decrease following Wednesday’s soft CPI figures. The 2-year yield fell to 4.86%, the 5-year rate to 4%, and the 10-year yield to 3.80%. The 2-year and 5-year rates are displaying a 6% decline on the week, and the 10-year nearly a 3% fall, allowing the XAG/USD to advance.
According to the CME FedWatch tool, investors continue to bet on a 25 basis point hike by the Federal Reserve (Fed) in July. The falling yields reflect the decline in the odds of an additional hike following July which stand near 15% vs 40% at the start of the week.
The daily chart suggests a (very) bullish outlook for the grey metal for the short term. The price trades above its main Simple Moving Averages (SMAs) of 20, 100 and 200 days while technical indicators hint at a strong bullish momentum. In that sense, the Relative Strength Index (RSI) points north near overbought conditions while the Moving Average Convergence Divergence (MACD) prints rising green bars.
Resistance Levels: $25.00, $25.30, $25.60.
Support Levels: $24.05, $23.50 (100-day SMA), $23.10 (20-day SMA),.
Technical Levels: Supports and Resistances
XAGUSD currently trading at 24.73 at the time of writing. Pair opened at 24.12 and is trading with a change of 2.53 % .
| Overview | Overview.1 | |
|---|---|---|
| 0 | Today last price | 24.73 |
| 1 | Today Daily Change | 0.61 |
| 2 | Today Daily Change % | 2.53 |
| 3 | Today daily open | 24.12 |
The pair remains strongly bullish on the daily timeframe. It trades above its 20 SMA @ 23.07, 50 SMA 23.63, 100 SMA @ 23.45 and 200 SMA @ 22.73.
| Trends | Trends.1 | |
|---|---|---|
| 0 | Daily SMA20 | 23.07 |
| 1 | Daily SMA50 | 23.63 |
| 2 | Daily SMA100 | 23.45 |
| 3 | Daily SMA200 | 22.73 |
The previous day high was 24.15 while the previous day low was 23.12. The daily 38.2% Fib levels comes at 23.76, expected to provide support. Similarly, the daily 61.8% fib level is at 23.51, expected to provide support.
Note the levels of interest below:
- Pivot support is noted at 23.44, 22.76, 22.41
- Pivot resistance is noted at 24.48, 24.83, 25.51
| Levels | Levels.1 |
|---|---|
| Previous Daily High | 24.15 |
| Previous Daily Low | 23.12 |
| Previous Weekly High | 23.31 |
| Previous Weekly Low | 22.52 |
| Previous Monthly High | 24.53 |
| Previous Monthly Low | 22.11 |
| Daily Fibonacci 38.2% | 23.76 |
| Daily Fibonacci 61.8% | 23.51 |
| Daily Pivot Point S1 | 23.44 |
| Daily Pivot Point S2 | 22.76 |
| Daily Pivot Point S3 | 22.41 |
| Daily Pivot Point R1 | 24.48 |
| Daily Pivot Point R2 | 24.83 |
| Daily Pivot Point R3 | 25.51 |
[/s2If]
Download Nehcap EAWe have two EAs that are operational on our LIVE accounts.
- EA-FIX: Check out the details here. Download EA-FIX . EA-FIX is a non-grid HFT scalper.
- EA-GROWTH: High quality low dd EA using trend grids. Download EA_GROWTHJoin Our Telegram Group
")


