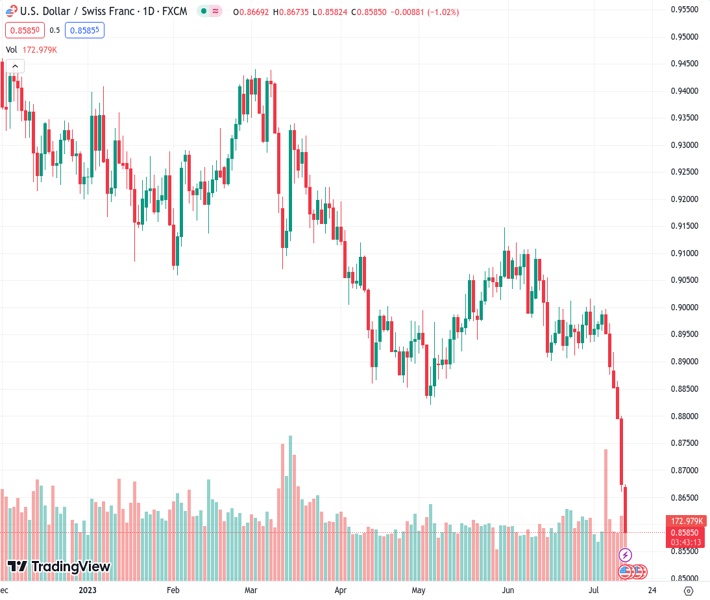
The USDCHF currency pair experienced a decrease of over 0.85% in value, dropping below the 0.8600 threshold.
…
This is a premium post.
[s2If !current_user_can(access_s2member_level4)]Please register for FREE REGISTER to read full post below containing analysis. In case of any error or you think you are not able to read the full post below, please email us at support#nehcap.com [lwa][/s2If] [s2If current_user_can(access_s2member_level1)]
- USD/CHF recorded more than 0.85% losses on the day, falling below the 0.8600 mark.
The pair currently trades last at 0.85871.
The previous day high was 0.88 while the previous day low was 0.8659. The daily 38.2% Fib levels comes at 0.8713, expected to provide resistance. Similarly, the daily 61.8% fib level is at 0.8746, expected to provide resistance.
On Thursday, the USD/CHF tallied a six-day losing streak, falling below the 0.8600 mark for the first time since January 2015. In that sense, soft Consumer Price Index (CPI) and Produce Price Index (PPI) data from the US fueled a widespread USD weakness as its DXY index fell below the 100.00 level for the first time since April 2022.
The Producer Price Index (PPI) from the US from June came in at 0.1% MoM, less than the 0.2% anticipated, and the Core Figure came in at 2.4%, falling short of the 2.6% forecast. Furthermore, US Jobless Claims for the week ending July 7 slowed down. It was reported that 237K people filed their first state unemployment insurance claims, less than the consensus estimate of 250K and the previous figure of 249K.
The yields on US Treasury bonds are falling in response to the US data. The 2-year yield decreased to 4.62%, the 5-year rate to 3.85%, and the 10-year yield decreased to 3.77% all displaying more than 2% slides.
Despite this, the CME FedWatch tool indicates that investors continue to wager on a 25 basis point increase by the Federal Reserve (Fed) in July. The declining yields reflect a drop in the likelihood of a subsequent hike after July, which is now just about 15%, down from 40% at the beginning of the week.
On the CHF’s side, investors will eye the release of the Producer Price Index from Switzerland from June on Friday, expected to decline 0.2% MoM from the previous 0.3% reading.
According to the daily chart, the daily chart suggests a bearish outlook for the USD/CHF. However, the Relative Strength Index (RSI) pierced through the oversold threshold of 70.00, suggesting that an upwards correction may be on the horizon to consolidate the latest downward movements.
If there is an upwards correction, short-term resistance levels line up at 0.8665, 0.8700 and 0.8750. In case bears continue to gain momentum, supports are seen at 0.8500, 0.8360 and 0.8300 (January 15, 2015 low).
Technical Levels: Supports and Resistances
USDCHF currently trading at 0.8586 at the time of writing. Pair opened at 0.8674 and is trading with a change of -1.01 % .
| Overview | Overview.1 | |
|---|---|---|
| 0 | Today last price | 0.8586 |
| 1 | Today Daily Change | -0.0088 |
| 2 | Today Daily Change % | -1.0100 |
| 3 | Today daily open | 0.8674 |
The pair remains strongly bearish on the daily time frame. It trades below the 20 SMA @ 0.8927, 50 SMA 0.8976, 100 SMA @ 0.9056 and 200 SMA @ 0.9266.
| Trends | Trends.1 | |
|---|---|---|
| 0 | Daily SMA20 | 0.8927 |
| 1 | Daily SMA50 | 0.8976 |
| 2 | Daily SMA100 | 0.9056 |
| 3 | Daily SMA200 | 0.9266 |
The previous day high was 0.88 while the previous day low was 0.8659. The daily 38.2% Fib levels comes at 0.8713, expected to provide resistance. Similarly, the daily 61.8% fib level is at 0.8746, expected to provide resistance.
Note the levels of interest below:
- Pivot support is noted at 0.8622, 0.857, 0.8481
- Pivot resistance is noted at 0.8764, 0.8852, 0.8905
| Levels | Levels.1 |
|---|---|
| Previous Daily High | 0.8800 |
| Previous Daily Low | 0.8659 |
| Previous Weekly High | 0.9005 |
| Previous Weekly Low | 0.8876 |
| Previous Monthly High | 0.9120 |
| Previous Monthly Low | 0.8902 |
| Daily Fibonacci 38.2% | 0.8713 |
| Daily Fibonacci 61.8% | 0.8746 |
| Daily Pivot Point S1 | 0.8622 |
| Daily Pivot Point S2 | 0.8570 |
| Daily Pivot Point S3 | 0.8481 |
| Daily Pivot Point R1 | 0.8764 |
| Daily Pivot Point R2 | 0.8852 |
| Daily Pivot Point R3 | 0.8905 |
[/s2If]
Download Nehcap EAWe have two EAs that are operational on our LIVE accounts.
- EA-FIX: Check out the details here. Download EA-FIX . EA-FIX is a non-grid HFT scalper.
- EA-GROWTH: High quality low dd EA using trend grids. Download EA_GROWTHJoin Our Telegram Group
")


