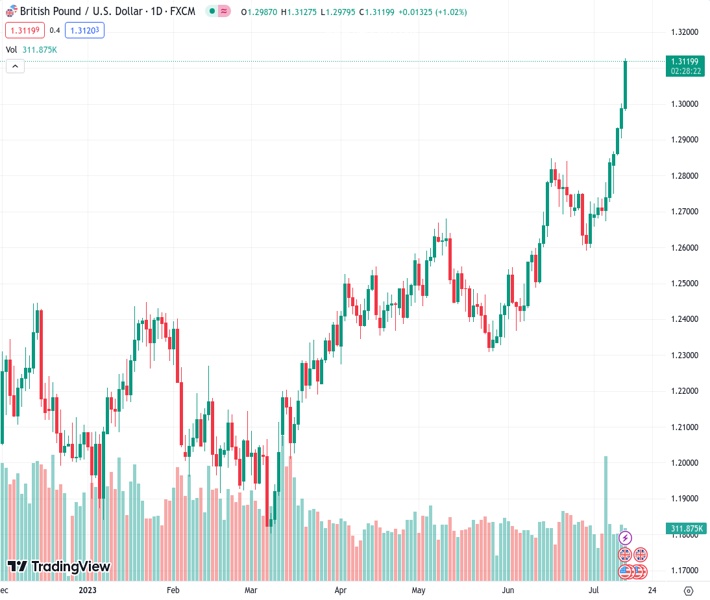
The US Producer Price Index (PPI) for June, which is below expectations, indicates that inflation in the US is gradually slowing down. The current exchange rate for GBPUSD is 1.31207.
…
This is a premium post.
[s2If !current_user_can(access_s2member_level4)]Please register for FREE REGISTER to read full post below containing analysis. In case of any error or you think you are not able to read the full post below, please email us at support#nehcap.com [lwa][/s2If] [s2If current_user_can(access_s2member_level1)]
- The US Producer Price Index (PPI) for June rose below estimates, suggesting a steady deceleration of inflation in the US.
The pair currently trades last at 1.31207.
The previous day high was 1.3001 while the previous day low was 1.2904. The daily 38.2% Fib levels comes at 1.2964, expected to provide support. Similarly, the daily 61.8% fib level is at 1.2941, expected to provide support.
GBP/USD rallies past the 1.3100 mark and is gaining close to 1% on Thursday, as overall US Dollar (USD) weakness extended amid speculations the Federal Reserve (Fed) is closing to finishing its tightening cycle after June’s PPI and CPI data was softer than expected. The GBP/USD is exchanging hands at 1.3111 after hitting a daily low of 1.2979.
GBP/USD accelerated its gains after the US Bureau of Labor Statistics (BLS) revealed that prices paid by producers, also known as the Producer Price Index (PPI) in June, rose below estimates, suggesting the deflation process in the US is gathering pace. PPI rose by 0.1% YoY, below forecasts of 0.4%, down ticked from May 1.1%. Core PPI, which strips volatile items, showed signs of losing steam and expanded at a 2.4% YoY pace, below estimates of 2.6% and the previous month’s 2.8%.
At the same time, the BLS informed that Initial Jobless Claims for the week ending July 5 climbed less than estimates of 250K, standing at 237K. Even though the data portrays a tight labor market, investors ignored it, as the Fed’s primary focus remained on inflation.
Despite the inflation downtrend continuing, the Federal Reserve is estimated to raise rates by 25 bps at the upcoming July meeting. However, bets for the rest of the year, paired as shown by November’s odds standing at 21%, according to CME FedWatch Tool.
On the UK front, the UK economy dodged a recession, as UK’s GDP growth for the last 3-months came at 0%, while month-over-month (MoM) figures in May dropped -0.1%, trailing April’s 0.2% expansion. Although the economy didn’t grow, concerns of a recession loom, as the Bank of England (BoE) is set to tighten monetary policy to curb high inflation at 8.6 percent levels.
the GBP/USD is set to test the 2021 yearly low of 1.3160 after storming through the 1.3000 figure, which didn’t last long enough, to refrain buyers from committing to open fresh long bets, that Sterling (GBP) would continue to edge higher. A decisive break above the former could put the 1.3200 figure on the table; otherwise, a healthy correction could send the pair dipping towards the 1.3100 psychological level before diving to July 12 daily high at 1.3000. Of note, the Relative Strength Index (RSI) is at overbought conditions, still shy of reaching the 80 levels, usually used as the extreme overbought area, after an asset witnessed a strong uptrend.
Technical Levels: Supports and Resistances
GBPUSD currently trading at 1.3123 at the time of writing. Pair opened at 1.2987 and is trading with a change of 1.05 % .
| Overview | Overview.1 | |
|---|---|---|
| 0 | Today last price | 1.3123 |
| 1 | Today Daily Change | 0.0136 |
| 2 | Today Daily Change % | 1.0500 |
| 3 | Today daily open | 1.2987 |
The pair remains strongly bullish on the daily timeframe. It trades above its 20 SMA @ 1.2764, 50 SMA 1.2599, 100 SMA @ 1.2438 and 200 SMA @ 1.2181.
| Trends | Trends.1 | |
|---|---|---|
| 0 | Daily SMA20 | 1.2764 |
| 1 | Daily SMA50 | 1.2599 |
| 2 | Daily SMA100 | 1.2438 |
| 3 | Daily SMA200 | 1.2181 |
The previous day high was 1.3001 while the previous day low was 1.2904. The daily 38.2% Fib levels comes at 1.2964, expected to provide support. Similarly, the daily 61.8% fib level is at 1.2941, expected to provide support.
Note the levels of interest below:
- Pivot support is noted at 1.2927, 1.2867, 1.283
- Pivot resistance is noted at 1.3024, 1.306, 1.312
| Levels | Levels.1 |
|---|---|
| Previous Daily High | 1.3001 |
| Previous Daily Low | 1.2904 |
| Previous Weekly High | 1.2850 |
| Previous Weekly Low | 1.2659 |
| Previous Monthly High | 1.2848 |
| Previous Monthly Low | 1.2369 |
| Daily Fibonacci 38.2% | 1.2964 |
| Daily Fibonacci 61.8% | 1.2941 |
| Daily Pivot Point S1 | 1.2927 |
| Daily Pivot Point S2 | 1.2867 |
| Daily Pivot Point S3 | 1.2830 |
| Daily Pivot Point R1 | 1.3024 |
| Daily Pivot Point R2 | 1.3060 |
| Daily Pivot Point R3 | 1.3120 |
[/s2If]
Download Nehcap EAWe have two EAs that are operational on our LIVE accounts.
- EA-FIX: Check out the details here. Download EA-FIX . EA-FIX is a non-grid HFT scalper.
- EA-GROWTH: High quality low dd EA using trend grids. Download EA_GROWTHJoin Our Telegram Group
")


