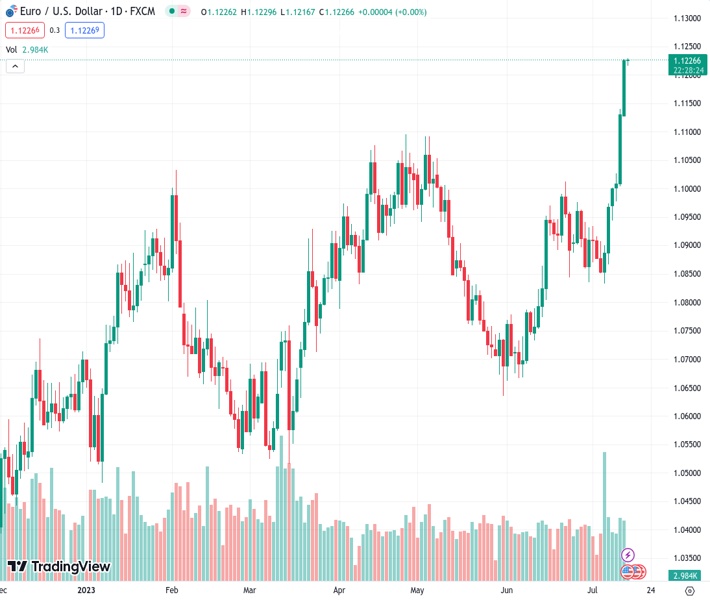
The EURUSD currency pair, currently at 1.12264, is fluctuating at its highest point since March 2022. It has reached a stable position after increasing for six consecutive days.
…
This is a premium post.
[s2If !current_user_can(access_s2member_level4)]Please register for FREE REGISTER to read full post below containing analysis. In case of any error or you think you are not able to read the full post below, please email us at support#nehcap.com [lwa][/s2If] [s2If current_user_can(access_s2member_level1)]
- EUR/USD seesaws at the highest level since March 2022, stabilizing after six-day uptrend.
The pair currently trades last at 1.12264.
The previous day high was 1.114 while the previous day low was 1.1005. The daily 38.2% Fib levels comes at 1.1089, expected to provide support. Similarly, the daily 61.8% fib level is at 1.1057, expected to provide support.
EUR/USD bulls take a breather at the highest levels in 16 months, bracing for the biggest weekly gain since November 2022, as it makes rounds to 1.1225-30 amid early Friday morning in Asia. In doing so, the Euro pair cheers the broad-based US Dollar weakness amid concerns that the Federal Reserve has limited scope to increase the interest rates past July. Additionally, downbeat US Treasury bond yields and hawkish clues from the European Central Bank (ECB) officials also propel the major currency pair.
US Dollar Index (DXY) dropped to the lowest level since April 2022 the previous day, down 2.45% on a week so far, as downbeat inflation clues from the US push back the Federal Reserve (Fed) hawks.
On Thursday, US Producer Price Index (PPI) came in as 0.1% YoY for June, versus 0.4% expected and 0.9% prior while the PPI ex Food & Energy, also known as the Core PPI, eased to 2.4% YoY from 2.8% previous reading and 2.6% market forecasts.
Earlier in the week, the US Consumer Price Index (CPI) registered a 3.0% YoY figure for June versus 3.1% market forecasts and 4.0% reported for May. Further details suggest that the CPI ex Food & Energy, also known as the Core CPI, softened to 4.8% yearly for the said month compared to analysts’ estimations of 5.0% and 5.3% previous readings.
That said, the US Weekly Initial Jobless Claims declined to 237K for the week ended on July 07, from 250K expected and 249K prior (revised).
Following the disappointing inflation data, the market’s expectations of the Fed rate hike past July have sharply deteriorated.
On the other hand, Eurozone Industrial Production eased to 0.2% MoM for May on a seasonally adjusted basis versus 0.3% market forecasts and 1.0% previous readings.
It should be noted, however, that the European Central Bank’s (ECB) June policy meeting revealed on Thursday that minimum of two successive rate hikes needed for inflation projections to materialize.
Alternatively, ECB Governing Council member Ignazio Visco said during an interview with Italy’s Sky TG24 news channel, “We are not very far’ from peak in interest rates.”
Against this backdrop, Wall Street cheers risk-on mood while the US 10-year and two-year Treasury bond yields plummet.
While the dovish Fed concerns propel the EUR/USD pair, today’s European Commission (EC) Economic Forecasts and trade numbers may direct the traders ahead of the preliminary readings of July’s Michigan Consumer Sentiment Index, as well as the five-day Consumer Inflation Expectations. Should the final clues of the US inflation appear downbeat, the Euro may easily aim for the previous yearly high of around 1.1500.
A daily closing beyond an ascending resistance line stretched from May 2022, around 1.1190 by the press time, keeps EUR/USD bulls hopeful of visiting the 1.1300 round figure.
Technical Levels: Supports and Resistances
EURUSD currently trading at 1.1225 at the time of writing. Pair opened at 1.1131 and is trading with a change of 0.84% % .
| Overview | Overview.1 | |
|---|---|---|
| 0 | Today last price | 1.1225 |
| 1 | Today Daily Change | 0.0094 |
| 2 | Today Daily Change % | 0.84% |
| 3 | Today daily open | 1.1131 |
The pair remains strongly bullish on the daily timeframe. It trades above its 20 SMA @ 1.0938, 50 SMA 1.0861, 100 SMA @ 1.0841 and 200 SMA @ 1.0638.
| Trends | Trends.1 | |
|---|---|---|
| 0 | Daily SMA20 | 1.0938 |
| 1 | Daily SMA50 | 1.0861 |
| 2 | Daily SMA100 | 1.0841 |
| 3 | Daily SMA200 | 1.0638 |
The previous day high was 1.114 while the previous day low was 1.1005. The daily 38.2% Fib levels comes at 1.1089, expected to provide support. Similarly, the daily 61.8% fib level is at 1.1057, expected to provide support.
Note the levels of interest below:
- Pivot support is noted at 1.1044, 1.0956, 1.0908
- Pivot resistance is noted at 1.1179, 1.1228, 1.1315
| Levels | Levels.1 |
|---|---|
| Previous Daily High | 1.1140 |
| Previous Daily Low | 1.1005 |
| Previous Weekly High | 1.0973 |
| Previous Weekly Low | 1.0834 |
| Previous Monthly High | 1.1012 |
| Previous Monthly Low | 1.0662 |
| Daily Fibonacci 38.2% | 1.1089 |
| Daily Fibonacci 61.8% | 1.1057 |
| Daily Pivot Point S1 | 1.1044 |
| Daily Pivot Point S2 | 1.0956 |
| Daily Pivot Point S3 | 1.0908 |
| Daily Pivot Point R1 | 1.1179 |
| Daily Pivot Point R2 | 1.1228 |
| Daily Pivot Point R3 | 1.1315 |
[/s2If]
Download Nehcap EAWe have two EAs that are operational on our LIVE accounts.
- EA-FIX: Check out the details here. Download EA-FIX . EA-FIX is a non-grid HFT scalper.
- EA-GROWTH: High quality low dd EA using trend grids. Download EA_GROWTHJoin Our Telegram Group
")


