The US Dollar declined rapidly against other currencies after the US CPI data was announced.
…
This is a premium post.
[s2If !current_user_can(access_s2member_level4)]Please register for FREE REGISTER to read full post below containing analysis. In case of any error or you think you are not able to read the full post below, please email us at support#nehcap.com [lwa][/s2If] [s2If current_user_can(access_s2member_level1)]
- The US Dollar accelerated its slide across the board after the release of US CPI data.
The pair currently trades last at 1.11212.
The previous day high was 1.1027 while the previous day low was 1.0977. The daily 38.2% Fib levels comes at 1.1008, expected to provide support. Similarly, the daily 61.8% fib level is at 1.0996, expected to provide support.
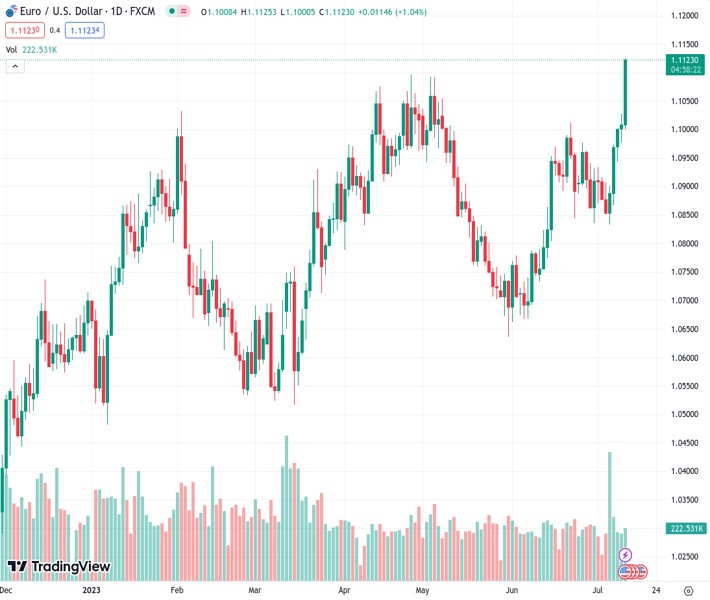
The EUR/USD pair continued to rise after the beginning of the American session, climbing to 1.1125, which is the highest level seen since March 2022. The pair remains near the top as the US Dollar continues under pressure following the release of US inflation data.
In June, the Consumer Price Index (CPI) rose 0.2% in the US, which was below the expected 0.3%, and the annual rate slowed to 3%, the lowest since March 2021 and below the expected 3.1%. Following the report, the US Dollar tumbled across the board, and US yields slid.
The US Dollar Index is trading at its lowest level in a year, at 100.60, falling for the fifth consecutive day. The US 10-year bond yield is at 3.87%, down 2.50%, and at a one-week low, far from the 4.09% it reached on Monday.
Market participants still expect a rate hike at the next FOMC meeting on July 25-26. However, bets of another rate hike before year-end have significantly reduced after the inflation data.
The EUR/USD pair is having its biggest daily gains in months. In the daily chart, the Relative Strength Index is reaching 70; however, no signs of a correction are seen, and the momentum remains firm for the Euro. The 1.1090/1.1100 area has become the immediate support. On the upside, a strong resistance level emerges around 1.1170.
Technical Levels: Supports and Resistances
EURUSD currently trading at 1.1125 at the time of writing. Pair opened at 1.1009 and is trading with a change of 1.05 % .
| Overview | Overview.1 | |
|---|---|---|
| 0 | Today last price | 1.1125 |
| 1 | Today Daily Change | 0.0116 |
| 2 | Today Daily Change % | 1.0500 |
| 3 | Today daily open | 1.1009 |
The pair remains strongly bullish on the daily timeframe. It trades above its 20 SMA @ 1.0923, 50 SMA 1.086, 100 SMA @ 1.0836 and 200 SMA @ 1.0632.
| Trends | Trends.1 | |
|---|---|---|
| 0 | Daily SMA20 | 1.0923 |
| 1 | Daily SMA50 | 1.0860 |
| 2 | Daily SMA100 | 1.0836 |
| 3 | Daily SMA200 | 1.0632 |
The previous day high was 1.1027 while the previous day low was 1.0977. The daily 38.2% Fib levels comes at 1.1008, expected to provide support. Similarly, the daily 61.8% fib level is at 1.0996, expected to provide support.
Note the levels of interest below:
- Pivot support is noted at 1.0981, 1.0954, 1.0931
- Pivot resistance is noted at 1.1032, 1.1055, 1.1082
| Levels | Levels.1 |
|---|---|
| Previous Daily High | 1.1027 |
| Previous Daily Low | 1.0977 |
| Previous Weekly High | 1.0973 |
| Previous Weekly Low | 1.0834 |
| Previous Monthly High | 1.1012 |
| Previous Monthly Low | 1.0662 |
| Daily Fibonacci 38.2% | 1.1008 |
| Daily Fibonacci 61.8% | 1.0996 |
| Daily Pivot Point S1 | 1.0981 |
| Daily Pivot Point S2 | 1.0954 |
| Daily Pivot Point S3 | 1.0931 |
| Daily Pivot Point R1 | 1.1032 |
| Daily Pivot Point R2 | 1.1055 |
| Daily Pivot Point R3 | 1.1082 |
[/s2If]
Download Nehcap EAWe have two EAs that are operational on our LIVE accounts.
- EA-FIX: Check out the details here. Download EA-FIX . EA-FIX is a non-grid HFT scalper.
- EA-GROWTH: High quality low dd EA using trend grids. Download EA_GROWTHJoin Our Telegram Group
")


