The price of silver, represented by #XAGUSD, surges towards $24.00 with a gain of more than 4% due to a decrease in US inflation, suggesting a more relaxed approach from the Federal Reserve.
…
This is a premium post.
[s2If !current_user_can(access_s2member_level4)]Please register for FREE REGISTER to read full post below containing analysis. In case of any error or you think you are not able to read the full post below, please email us at support#nehcap.com [lwa][/s2If] [s2If current_user_can(access_s2member_level1)]
- Silver price leaps toward $24.00, gaining over 4% as US inflation decelerates, indicating a softer stance from the Fed.
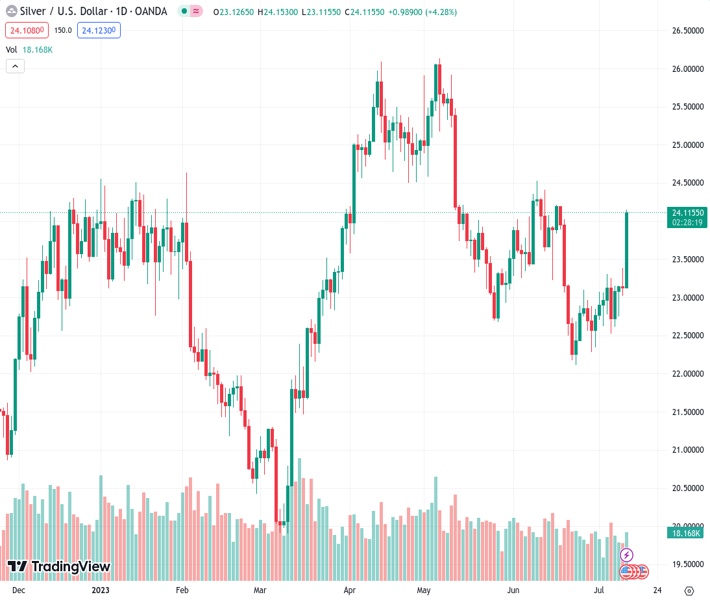
The pair currently trades last at 24.116.
The previous day high was 23.39 while the previous day low was 23.02. The daily 38.2% Fib levels comes at 23.16, expected to provide support. Similarly, the daily 61.8% fib level is at 23.25, expected to provide support.
Silver price surged toward the $24.00 region on Wednesday following the release of the US Consumer Price Index (CPI), which showed inflationary pressures tumbling, suggesting the Federal Reserve (Fed) would not need to tighten as aggressively expected. The XAG/USD is trading at $24.07, gaining more than 4%, after hitting a low of $23.11.
The XAG/USD shifted from a neutral-downward biased to upward as price action broke technical resistance levels, with buyers eyeing a downslope resistance trendline, previously broken, which remains in play at around $24.30/45. If XAG/USD surpasses the latter, April’s 29 daily low at $24.49 would be up for grabs before XAG/USD threatens $25.00 per troy ounce.
Conversely, XAG/USD’s failure to achieve a daily close above $24.00 will expose the non-yielding metal to further losses. First, support will emerge at the 50-day EMA at $23.43, the 100-day EMA at $23.36, and then the 20-day EMA at $23.17. Once those levels are cleared, the 200-day EMA is up next at $22.95.
The Relative Strength Index (RSI) at bullish territory, the same as the three-day Rate of Change (RoC), suggests XAG buyers remain in charge. The XAG/USD uptrend is in play but look for breaks above $24.20 to gather further strength.
Technical Levels: Supports and Resistances
XAGUSD currently trading at 24.11 at the time of writing. Pair opened at 23.13 and is trading with a change of 4.24 % .
| Overview | Overview.1 | |
|---|---|---|
| 0 | Today last price | 24.11 |
| 1 | Today Daily Change | 0.98 |
| 2 | Today Daily Change % | 4.24 |
| 3 | Today daily open | 23.13 |
The pair remains strongly bullish on the daily timeframe. It trades above its 20 SMA @ 23.06, 50 SMA 23.65, 100 SMA @ 23.43 and 200 SMA @ 22.71.
| Trends | Trends.1 | |
|---|---|---|
| 0 | Daily SMA20 | 23.06 |
| 1 | Daily SMA50 | 23.65 |
| 2 | Daily SMA100 | 23.43 |
| 3 | Daily SMA200 | 22.71 |
The previous day high was 23.39 while the previous day low was 23.02. The daily 38.2% Fib levels comes at 23.16, expected to provide support. Similarly, the daily 61.8% fib level is at 23.25, expected to provide support.
Note the levels of interest below:
- Pivot support is noted at 22.97, 22.81, 22.6
- Pivot resistance is noted at 23.34, 23.55, 23.71
| Levels | Levels.1 |
|---|---|
| Previous Daily High | 23.39 |
| Previous Daily Low | 23.02 |
| Previous Weekly High | 23.31 |
| Previous Weekly Low | 22.52 |
| Previous Monthly High | 24.53 |
| Previous Monthly Low | 22.11 |
| Daily Fibonacci 38.2% | 23.16 |
| Daily Fibonacci 61.8% | 23.25 |
| Daily Pivot Point S1 | 22.97 |
| Daily Pivot Point S2 | 22.81 |
| Daily Pivot Point S3 | 22.60 |
| Daily Pivot Point R1 | 23.34 |
| Daily Pivot Point R2 | 23.55 |
| Daily Pivot Point R3 | 23.71 |
[/s2If]
Download Nehcap EAWe have two EAs that are operational on our LIVE accounts.
- EA-FIX: Check out the details here. Download EA-FIX . EA-FIX is a non-grid HFT scalper.
- EA-GROWTH: High quality low dd EA using trend grids. Download EA_GROWTHJoin Our Telegram Group
")


