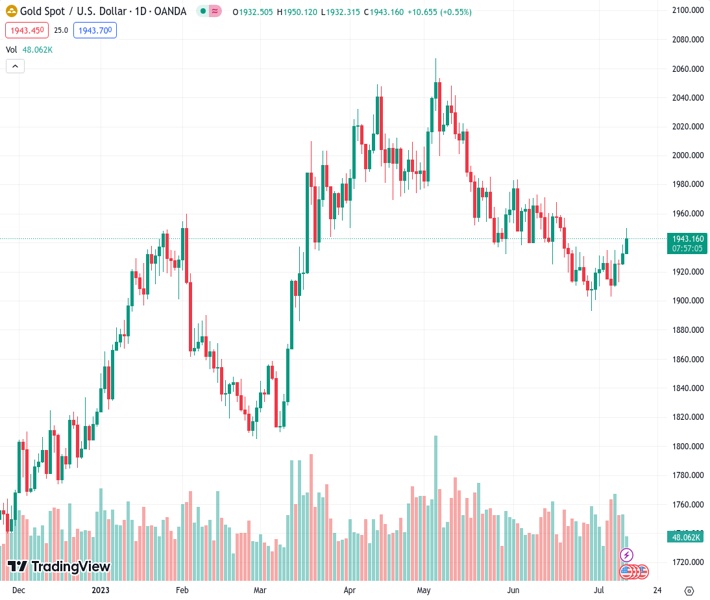
The price of gold, indicated by #XAUUSD @ 1,942.70, has experienced a significant increase to $1,950.00 due to the fact that US inflation has decreased more than anticipated.
…
This is a premium post.
[s2If !current_user_can(access_s2member_level4)]Please register for FREE REGISTER to read full post below containing analysis. In case of any error or you think you are not able to read the full post below, please email us at support#nehcap.com [lwa][/s2If] [s2If current_user_can(access_s2member_level1)]
- Gold price has climbed strongly to $1,950.00 as US inflation has softened more than expectations.
The pair currently trades last at 1942.70.
The previous day high was 1938.54 while the previous day low was 1924.44. The daily 38.2% Fib levels comes at 1933.15, expected to provide support. Similarly, the daily 61.8% fib level is at 1929.83, expected to provide support.
Gold price (XAU/USD) has displayed a stellar run as the United States Bureau of Labor Statistics has reported softer-than-expected June Consumer Price Index (CPI) data. The monthly headline and core inflation has reported a pace of 0.3% while investors were anticipating a higher velocity of 0.3%.
Annualized headline CPI has softened to 3.0% vs. the consensus of 3.1% and the former release of 4.0%. While annualized inflation has decelerated to 4.8% against the estimates of 5.0% and the prior release of 5.3%. More-than-anticipated cool-down in inflationary pressures would trim expectations of an interest rate hike by the Federal Reserve (Fed) in its July monetary policy meeting.
Meanwhile, S&P500 futures have jumped strongly as soft inflation figures have eased fears of a recession in the United States. The US Dollar Index (DXY) has demonstrated a vertical fall to near the crucial support of 101.00. The yields offered on 10-year US Treasury bonds have sharply dropped to 3.88%.
Going forward, investors will focus on Thursday’s Producer Price Index (PPI) data. As per the consensus, monthly PPI is expected to register a pace of 0.2% vs. a contraction of 0.3%. It looks like a mild recovery in gasoline prices has propelled factory gate prices.
Gold price is gathering strength to deliver a breakout of the Inverted Head and Shoulder chart pattern formed on a two-hour scale. A breakout of the aforementioned chart pattern will result in a bullish reversal. The neckline of the chart pattern is plotted around June 21 high at $1,940.00.
The 20-period Exponential Moving Average (EMA) at $1,932.90 is providing cushion to the Gold bulls.
Meanwhile, the Relative Strength Index (RSI) (14) has confidently shifted into the bullish range of 60.00-80.00, which indicates that the bullish momentum has been triggered.
Technical Levels: Supports and Resistances
XAUUSD currently trading at 1934.05 at the time of writing. Pair opened at 1932.26 and is trading with a change of 0.09 % .
| Overview | Overview.1 | |
|---|---|---|
| 0 | Today last price | 1934.05 |
| 1 | Today Daily Change | 1.79 |
| 2 | Today Daily Change % | 0.09 |
| 3 | Today daily open | 1932.26 |
The pair is trading above its 20 Daily moving average @ 1927.0, below its 50 Daily moving average @ 1959.16 , below its 100 Daily moving average @ 1949.73 and above its 200 Daily moving average @ 1868.82
| Trends | Trends.1 | |
|---|---|---|
| 0 | Daily SMA20 | 1927.00 |
| 1 | Daily SMA50 | 1959.16 |
| 2 | Daily SMA100 | 1949.73 |
| 3 | Daily SMA200 | 1868.82 |
The previous day high was 1938.54 while the previous day low was 1924.44. The daily 38.2% Fib levels comes at 1933.15, expected to provide support. Similarly, the daily 61.8% fib level is at 1929.83, expected to provide support.
Note the levels of interest below:
- Pivot support is noted at 1924.95, 1917.65, 1910.85
- Pivot resistance is noted at 1939.05, 1945.85, 1953.15
| Levels | Levels.1 |
|---|---|
| Previous Daily High | 1938.54 |
| Previous Daily Low | 1924.44 |
| Previous Weekly High | 1935.09 |
| Previous Weekly Low | 1902.77 |
| Previous Monthly High | 1983.50 |
| Previous Monthly Low | 1893.01 |
| Daily Fibonacci 38.2% | 1933.15 |
| Daily Fibonacci 61.8% | 1929.83 |
| Daily Pivot Point S1 | 1924.95 |
| Daily Pivot Point S2 | 1917.65 |
| Daily Pivot Point S3 | 1910.85 |
| Daily Pivot Point R1 | 1939.05 |
| Daily Pivot Point R2 | 1945.85 |
| Daily Pivot Point R3 | 1953.15 |
[/s2If]
Download Nehcap EAWe have two EAs that are operational on our LIVE accounts.
- EA-FIX: Check out the details here. Download EA-FIX . EA-FIX is a non-grid HFT scalper.
- EA-GROWTH: High quality low dd EA using trend grids. Download EA_GROWTHJoin Our Telegram Group
")


