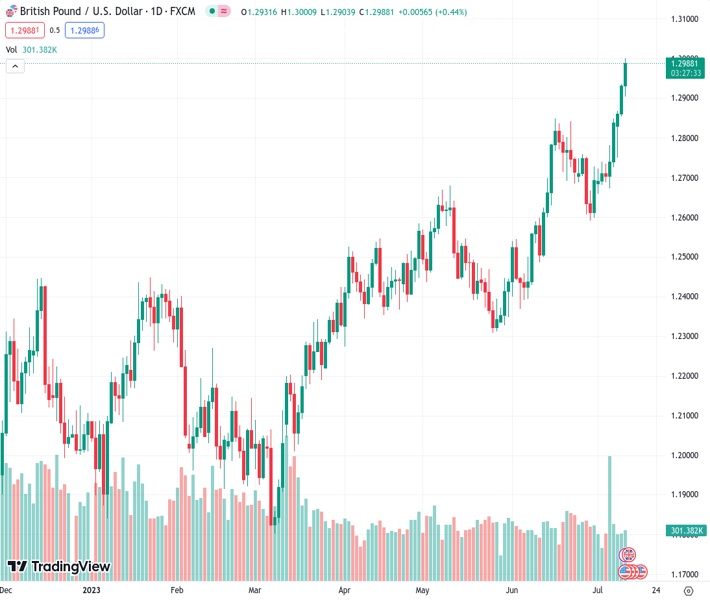
The GBPUSD currency pair surges to its highest level in 15 months, reaching 1.29880, due to a decrease in US inflation data which weakens the Dollar.
…
This is a premium post.
[s2If !current_user_can(access_s2member_level4)]Please register for FREE REGISTER to read full post below containing analysis. In case of any error or you think you are not able to read the full post below, please email us at support#nehcap.com [lwa][/s2If] [s2If current_user_can(access_s2member_level1)]
- GBP/USD pair skyrockets to a 15-month high as cooling US inflation data curtails Dollar’s strength.
The pair currently trades last at 1.29880.
The previous day high was 1.2935 while the previous day low was 1.2857. The daily 38.2% Fib levels comes at 1.2905, expected to provide support. Similarly, the daily 61.8% fib level is at 1.2887, expected to provide support.
GBP/USD advanced sharply and touched a new 15-month high at 1.3000 during the North American session as data revealed before Wall Street opened showed the Consumer Price Index (CPI) in the US hitting its lowest level in two years, as inflation abates following 500 basis points of tightening. Hence, the GBP/USD is exchanging hands at 1.2989, gains 0.45%, after hitting a low of 1.2902.
According to the latest data from the US Bureau of Labor Statistics (BLS), inflation in the United States experienced a significant deceleration in June. The Consumer Price Index (CPI) revealed a year-on-year increase of 3.0%, falling below the estimated 3.1%. Furthermore, the Core CPI, which excludes volatile items such as food and energy, decreased by 0.5%, dropping from 5.3% in May to 4.8% last month.
The latest inflation report shows that inflation is approaching the 2% target faster than expected, according to Federal Reserve (Fed) projections delivered at June’s monetary policy meeting. That could refrain policymakers from increasing rates past the July FOMC’s decision.
According to the CME FedWatch Tool, there is a high probability of 92.4% for a 25 basis points rate increase in the upcoming July meeting. However, the likelihood of additional interest rate hikes has diminished significantly, falling below 30%.
The US Dollar Index (DXY), which measures the value of the US dollar against a basket of other major currencies, continues to face downward pressure and is currently trading near its two-year lows. The DXY is at 100.597, reflecting a decline of 1.04%.
Federal Reserve speakers had crossed the wires earlier in the New York session, led by Richmond Fed President Thomas Barking, saying. that inflation is too high and emphasizing he’s comfortable doing more to tackle inflation. Recently, the Minnesota Fed President Neil Kashkari noted that the Fed’s fight against inflation must be won and that if it gets higher, hikes must be raised.
On the UK front, the latest employment report increased the odds for further tightening by the Bank of England (BoE), with the inflation level still at an 8.6% annualized rate. Expectations lie for a 50 basis point rate hike, while upcoming growth data could weigh on the BoE’s decision, which walks a fine line between raising rates to tackle inflation without slowing the economy to the point of triggering a recession.
From a technical perspective, the GBP/USD daily chart shows the pair is in a strong uptrend, with buyers eyeing an April 22, 2022, daily high of 1.3035, below the 2021 yearly low of 1.3160. It should be said the Relative Strength Index (RSI) entered overbought conditions, but in a strong uptrend, the indicator could reach its extreme readings at around or past the 80.00 mark. That said, the GBP/USD could threaten 1.3000 and extend its gains to 1.3100. Conversely, if GBP/USD slumps below the July 11 low of 1.2853, that could exacerbate a test of the 1.2800 figure, followed by the 20-day Exponential Moving Average (EMA) at 1.2750.
Technical Levels: Supports and Resistances
GBPUSD currently trading at 1.299 at the time of writing. Pair opened at 1.2933 and is trading with a change of 0.44 % .
| Overview | Overview.1 | |
|---|---|---|
| 0 | Today last price | 1.2990 |
| 1 | Today Daily Change | 0.0057 |
| 2 | Today Daily Change % | 0.4400 |
| 3 | Today daily open | 1.2933 |
The pair remains strongly bullish on the daily timeframe. It trades above its 20 SMA @ 1.2748, 50 SMA 1.2591, 100 SMA @ 1.2429 and 200 SMA @ 1.2172.
| Trends | Trends.1 | |
|---|---|---|
| 0 | Daily SMA20 | 1.2748 |
| 1 | Daily SMA50 | 1.2591 |
| 2 | Daily SMA100 | 1.2429 |
| 3 | Daily SMA200 | 1.2172 |
The previous day high was 1.2935 while the previous day low was 1.2857. The daily 38.2% Fib levels comes at 1.2905, expected to provide support. Similarly, the daily 61.8% fib level is at 1.2887, expected to provide support.
Note the levels of interest below:
- Pivot support is noted at 1.2882, 1.2831, 1.2804
- Pivot resistance is noted at 1.296, 1.2986, 1.3037
| Levels | Levels.1 |
|---|---|
| Previous Daily High | 1.2935 |
| Previous Daily Low | 1.2857 |
| Previous Weekly High | 1.2850 |
| Previous Weekly Low | 1.2659 |
| Previous Monthly High | 1.2848 |
| Previous Monthly Low | 1.2369 |
| Daily Fibonacci 38.2% | 1.2905 |
| Daily Fibonacci 61.8% | 1.2887 |
| Daily Pivot Point S1 | 1.2882 |
| Daily Pivot Point S2 | 1.2831 |
| Daily Pivot Point S3 | 1.2804 |
| Daily Pivot Point R1 | 1.2960 |
| Daily Pivot Point R2 | 1.2986 |
| Daily Pivot Point R3 | 1.3037 |
[/s2If]
Download Nehcap EAWe have two EAs that are operational on our LIVE accounts.
- EA-FIX: Check out the details here. Download EA-FIX . EA-FIX is a non-grid HFT scalper.
- EA-GROWTH: High quality low dd EA using trend grids. Download EA_GROWTHJoin Our Telegram Group
")


