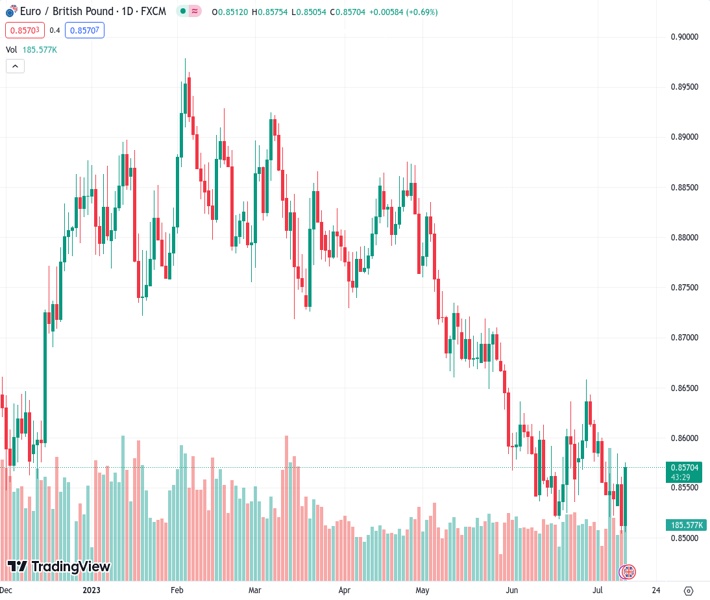
The currency pair EURGBP, currently trading at 0.85706, experiences a notable increase from its lowest point this year, rising by 70 pips and gaining 0.72%. This surge is driven by the upward movement of EUR/USD.
…
This is a premium post.
[s2If !current_user_can(access_s2member_level4)]Please register for FREE REGISTER to read full post below containing analysis. In case of any error or you think you are not able to read the full post below, please email us at support#nehcap.com [lwa][/s2If] [s2If current_user_can(access_s2member_level1)]
- EUR/GBP sees a significant bounce from YTD lows, climbing 70 pips and gaining 0.72%, spurred by rising EUR/USD.
The pair currently trades last at 0.85706.
The previous day high was 0.8561 while the previous day low was 0.8504. The daily 38.2% Fib levels comes at 0.8526, expected to provide support. Similarly, the daily 61.8% fib level is at 0.8539, expected to provide support.
EUR/GBP jumps from year-to-date (YTD) lows of 0.8504, climbs 70 pips, and gains 0.72% on Wednesday, underpinned by the rise of the EUR/USD pair. The EUR/GBP is exchanging hands at 0.8571 after hitting a daily low of 0.8505.
After diving to a new YTD low of 0.8504, the EUR/GBP has risen sharply toward the 20-day Exponential Moving Average (EMA) at 0.8571. During the last couple of days, EUR/GBP’s price action formed a bullish engulfing candlestick pattern, suggesting further upside is expected; nevertheless, a daily close above the latter is needed to keep bulls’ hopes alive.
The EUR/GBP first supply zone to test would be the 0.8600 mark. Once cleared, the next stop will be the 50-day EMA at 0.8621, followed by the June 28 swing high at 0.8658. A breach of the latter will shift the cross-pair bias to neutral and expose key resistance levels. The next resistance will be the 200-day EMA at 0.8684, ahead of testing at 0.8700.
Notably, the Relative Strength Index (RSI) is about to turn bullish, while the three-day Rate of Change (RoC) depicts buyers gathering momentum. That said, the EUR/GBP is upward in the near term.
Technical Levels: Supports and Resistances
EURGBP currently trading at 0.8572 at the time of writing. Pair opened at 0.8512 and is trading with a change of 0.7 % .
| Overview | Overview.1 | |
|---|---|---|
| 0 | Today last price | 0.8572 |
| 1 | Today Daily Change | 0.0060 |
| 2 | Today Daily Change % | 0.7000 |
| 3 | Today daily open | 0.8512 |
The pair is trading above its 20 Daily moving average @ 0.8569, below its 50 Daily moving average @ 0.8626 , below its 100 Daily moving average @ 0.872 and below its 200 Daily moving average @ 0.8735
| Trends | Trends.1 | |
|---|---|---|
| 0 | Daily SMA20 | 0.8569 |
| 1 | Daily SMA50 | 0.8626 |
| 2 | Daily SMA100 | 0.8720 |
| 3 | Daily SMA200 | 0.8735 |
The previous day high was 0.8561 while the previous day low was 0.8504. The daily 38.2% Fib levels comes at 0.8526, expected to provide support. Similarly, the daily 61.8% fib level is at 0.8539, expected to provide support.
Note the levels of interest below:
- Pivot support is noted at 0.849, 0.8469, 0.8433
- Pivot resistance is noted at 0.8548, 0.8583, 0.8605
| Levels | Levels.1 |
|---|---|
| Previous Daily High | 0.8561 |
| Previous Daily Low | 0.8504 |
| Previous Weekly High | 0.8606 |
| Previous Weekly Low | 0.8521 |
| Previous Monthly High | 0.8658 |
| Previous Monthly Low | 0.8518 |
| Daily Fibonacci 38.2% | 0.8526 |
| Daily Fibonacci 61.8% | 0.8539 |
| Daily Pivot Point S1 | 0.8490 |
| Daily Pivot Point S2 | 0.8469 |
| Daily Pivot Point S3 | 0.8433 |
| Daily Pivot Point R1 | 0.8548 |
| Daily Pivot Point R2 | 0.8583 |
| Daily Pivot Point R3 | 0.8605 |
[/s2If]
Download Nehcap EAWe have two EAs that are operational on our LIVE accounts.
- EA-FIX: Check out the details here. Download EA-FIX . EA-FIX is a non-grid HFT scalper.
- EA-GROWTH: High quality low dd EA using trend grids. Download EA_GROWTHJoin Our Telegram Group
")


