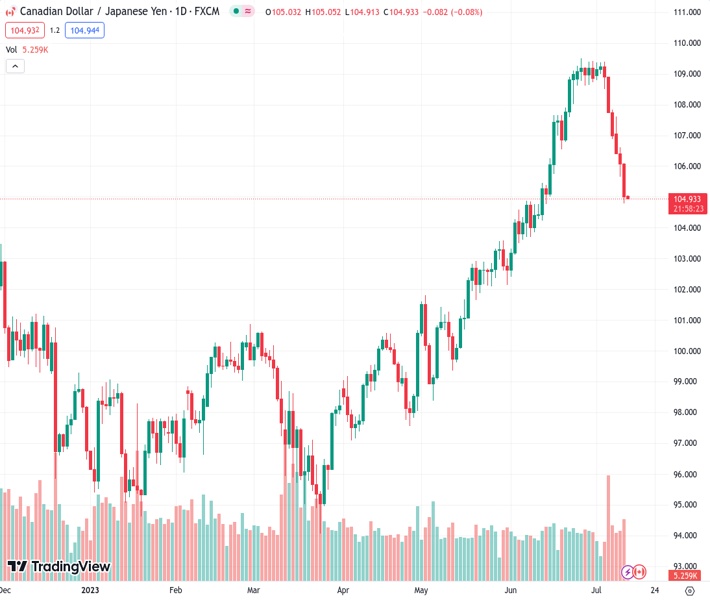
The CADJPY pair continues to experience losses for the seventh day in a row, showing a marginal decrease of 0.07%. It is currently trading close to its lowest point of the week, which is at 104.79.
…
This is a premium post.
[s2If !current_user_can(access_s2member_level4)]Please register for FREE REGISTER to read full post below containing analysis. In case of any error or you think you are not able to read the full post below, please email us at support#nehcap.com [lwa][/s2If] [s2If current_user_can(access_s2member_level1)]
- CAD/JPY extends losses for the seventh consecutive day, with minimal decline of 0.07%, trading near weekly low of 104.79.
The pair currently trades last at 104.9230.
The previous day high was 106.62 while the previous day low was 105.63. The daily 38.2% Fib levels comes at 106.01, expected to provide resistance. Similarly, the daily 61.8% fib level is at 106.24, expected to provide resistance.
As the Asian session begins, the CAD/JPY extends its losses to seven straight days, registering minimal losses of 0.07%. Despite the Bank of Canada (BoC) raising rates by 25 bps to 5% on Wednesday, the CAD/JPY pair failed to gain traction and lost 0.99% or 100 pips. As of writing, the CAD/JPY trades at 104.96, nearby the weekly low of 104.79.
The CAD/JPY daily chart portrays the pair as upward biased, similar to the AUD/JPY pair case published here. Even though the CAD/JPY edged lower, as long as it remains above the Ichimoku Cloudthe uptrend remains in place. But some mixed signals suggest caution is warranted, like prices sliding below the Tenkan-Sen and Kijun-Sen lines and the Chikou Span about to turn bearish can pave the way for further losses.
If CAD/JPY continues to drop, the June 7 daily high of 104.88 will be the first support level to challenge. A breach of the latter will expose the 104.00 mark, followed by the June 8 daily low of 103.70.
Conversely, the CAD/JPY first resistance would be 105.00 for a bullish continuation. Once cleared, the next resistance emerges at the June 13 daily high of 105.45, followed by the July 12 daily high of 106.11. the next resistance level would be the Kijun-Sen line at 106.60 before the Tenkan-Sen at 107.09.
Technical Levels: Supports and Resistances
CADJPY currently trading at 104.96 at the time of writing. Pair opened at 106.06 and is trading with a change of -1.04 % .
| Overview | Overview.1 | |
|---|---|---|
| 0 | Today last price | 104.96 |
| 1 | Today Daily Change | -1.10 |
| 2 | Today Daily Change % | -1.04 |
| 3 | Today daily open | 106.06 |
The pair is trading below its 20 Daily moving average @ 107.95, above its 50 Daily moving average @ 104.61 , above its 100 Daily moving average @ 101.59 and above its 200 Daily moving average @ 101.63
| Trends | Trends.1 | |
|---|---|---|
| 0 | Daily SMA20 | 107.95 |
| 1 | Daily SMA50 | 104.61 |
| 2 | Daily SMA100 | 101.59 |
| 3 | Daily SMA200 | 101.63 |
The previous day high was 106.62 while the previous day low was 105.63. The daily 38.2% Fib levels comes at 106.01, expected to provide resistance. Similarly, the daily 61.8% fib level is at 106.24, expected to provide resistance.
Note the levels of interest below:
- Pivot support is noted at 105.59, 105.11, 104.59
- Pivot resistance is noted at 106.58, 107.1, 107.57
| Levels | Levels.1 |
|---|---|
| Previous Daily High | 106.62 |
| Previous Daily Low | 105.63 |
| Previous Weekly High | 109.41 |
| Previous Weekly Low | 106.87 |
| Previous Monthly High | 109.51 |
| Previous Monthly Low | 102.41 |
| Daily Fibonacci 38.2% | 106.01 |
| Daily Fibonacci 61.8% | 106.24 |
| Daily Pivot Point S1 | 105.59 |
| Daily Pivot Point S2 | 105.11 |
| Daily Pivot Point S3 | 104.59 |
| Daily Pivot Point R1 | 106.58 |
| Daily Pivot Point R2 | 107.10 |
| Daily Pivot Point R3 | 107.57 |
[/s2If]
Download Nehcap EAWe have two EAs that are operational on our LIVE accounts.
- EA-FIX: Check out the details here. Download EA-FIX . EA-FIX is a non-grid HFT scalper.
- EA-GROWTH: High quality low dd EA using trend grids. Download EA_GROWTHJoin Our Telegram Group
")


