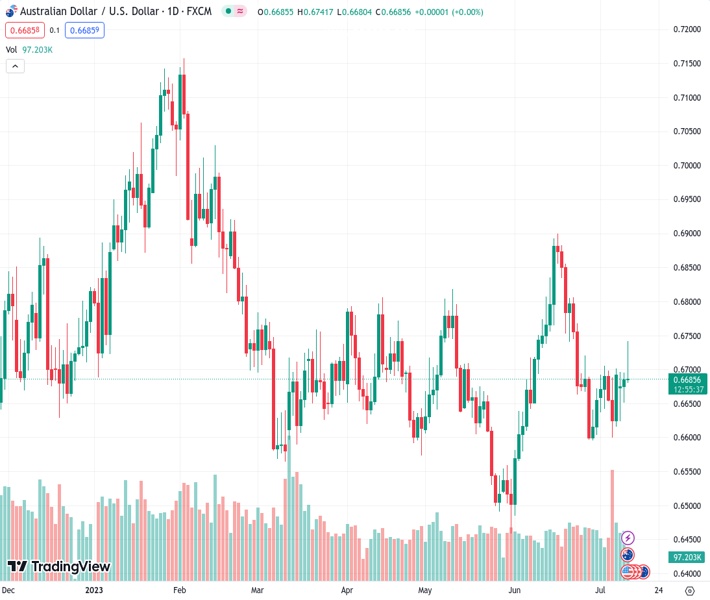
The AUDUSD pair, currently at 0.66863, is facing challenges in taking advantage of its upward momentum for the day, as it nears a high not seen in almost three weeks.
…
This is a premium post.
[s2If !current_user_can(access_s2member_level4)]Please register for FREE REGISTER to read full post below containing analysis. In case of any error or you think you are not able to read the full post below, please email us at support#nehcap.com [lwa][/s2If] [s2If current_user_can(access_s2member_level1)]
- AUD/USD struggles to capitalize on its intraday positive move to a nearly three-week high.
The pair currently trades last at 0.66863.
The previous day high was 0.6695 while the previous day low was 0.6651. The daily 38.2% Fib levels comes at 0.6678, expected to provide support. Similarly, the daily 61.8% fib level is at 0.6668, expected to provide support.
The AUD/USD pair retreats over 50 pips from a nearly three-week high touched this Wednesday and slides back below the 0.6700 round-figure mark during the early European session.
In the absence of any fresh fundamental development, the intraday pullback from the 0.6740 area could be attributed to some repositioning trade ahead of the key data risk – the release of the latest US consumer inflation figures. The crucial US CPI report is due for release later during the early North American session and will play a key role in influencing the Federal Reserve’s (Fed) rate-hike path. This, in turn, will drive the US Dollar (USD) demand in the near term and provide a fresh directional impetus to the AUD/USD pair.
In the meantime, speculations that the US central bank will end its current rate-hiking cycle after the widely expected lift-off in July continues to weigh on the buck. In fact, the USD Index (DXY), which tracks the Greenback against a basket of currencies, sinks to a two-month low as investors now seem convinced that the US central bank has limited headroom to continue tightening the monetary policy. Furthermore, signs of easing inflationary pressure could allow the Fed to soften its hawkish stance sooner rather than later.
This, in turn, leads to a further decline in the US Treasury bond yields, which, along with a generally positive risk tone, might continue to undermine the safe-haven USD and lend some support to the risk-sensitive. This, in turn, suggests that the path of least resistance for the AUD/USD pair is to the upside. That said, failure to find acceptance above a technically significant 200-day SMA warrants some caution for aggressive bullish traders and positioning for any further appreciating move, at least for the time being.
Technical Levels: Supports and Resistances
AUDUSD currently trading at 0.6694 at the time of writing. Pair opened at 0.6687 and is trading with a change of 0.1 % .
| Overview | Overview.1 | |
|---|---|---|
| 0 | Today last price | 0.6694 |
| 1 | Today Daily Change | 0.0007 |
| 2 | Today Daily Change % | 0.1000 |
| 3 | Today daily open | 0.6687 |
The pair is trading below its 20 Daily moving average @ 0.6718, above its 50 Daily moving average @ 0.6678 , above its 100 Daily moving average @ 0.6683 and below its 200 Daily moving average @ 0.6699
| Trends | Trends.1 | |
|---|---|---|
| 0 | Daily SMA20 | 0.6718 |
| 1 | Daily SMA50 | 0.6678 |
| 2 | Daily SMA100 | 0.6683 |
| 3 | Daily SMA200 | 0.6699 |
The previous day high was 0.6695 while the previous day low was 0.6651. The daily 38.2% Fib levels comes at 0.6678, expected to provide support. Similarly, the daily 61.8% fib level is at 0.6668, expected to provide support.
Note the levels of interest below:
- Pivot support is noted at 0.666, 0.6633, 0.6616
- Pivot resistance is noted at 0.6704, 0.6722, 0.6748
| Levels | Levels.1 |
|---|---|
| Previous Daily High | 0.6695 |
| Previous Daily Low | 0.6651 |
| Previous Weekly High | 0.6705 |
| Previous Weekly Low | 0.6599 |
| Previous Monthly High | 0.6900 |
| Previous Monthly Low | 0.6484 |
| Daily Fibonacci 38.2% | 0.6678 |
| Daily Fibonacci 61.8% | 0.6668 |
| Daily Pivot Point S1 | 0.6660 |
| Daily Pivot Point S2 | 0.6633 |
| Daily Pivot Point S3 | 0.6616 |
| Daily Pivot Point R1 | 0.6704 |
| Daily Pivot Point R2 | 0.6722 |
| Daily Pivot Point R3 | 0.6748 |
[/s2If]
Download Nehcap EAWe have two EAs that are operational on our LIVE accounts.
- EA-FIX: Check out the details here. Download EA-FIX . EA-FIX is a non-grid HFT scalper.
- EA-GROWTH: High quality low dd EA using trend grids. Download EA_GROWTHJoin Our Telegram Group
")


